cTrader용 자동 피보나치 RENKO
핵심 가격 수준을 자동으로 식별 — 전략에 맞게 완전히 사용자 정의 가능.
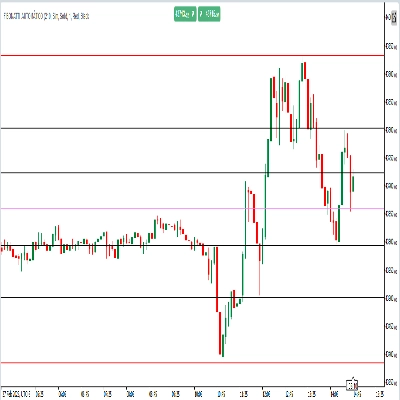
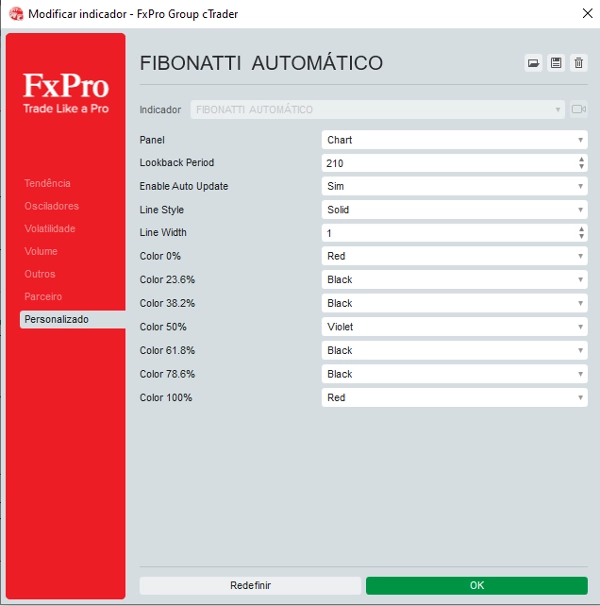
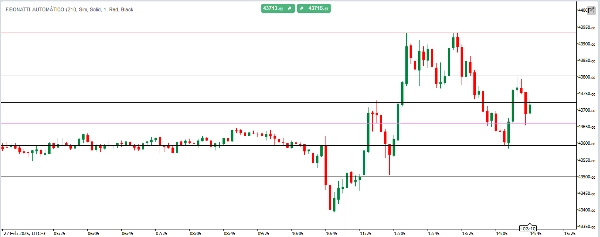
Auto Fibonacci는 사용자가 정의한 기간 동안의 최고가와 최저가를 기반으로 피보나치 되돌림 수준을 자동으로 그리는 스마트하고 유연한 지표입니다. 이 지표의 차별점은 완전한 사용자 정의에 있습니다: 각 피보나치 수준의 색상, 선 스타일 및 두께를 시각적 선호도와 거래 전략에 맞게 개인화할 수 있습니다. 또한 실시간 업데이트 기능이 있어 차트가 항상 최신 가격 움직임을 반영하며 수동 조정이 필요 없습니다.
지표 프로필
0.0
리뷰: 0
고객 리뷰
이 상품에 대한 리뷰가 아직 없습니다. 이미 사용해 보셨나요? 다른 사람들에게 가장 먼저 소개해 주세요!
트레이딩 봇, 지표, 플러그인 등 cTrader Store에서 제공되는 상품은 제3자 개발자에 의해 제공되며, 이는 단순히 정보 및 기술적 접근을 목적으로 제공된 것입니다. cTrader Store는 중개인이 아니며, 투자 조언, 개인별 추천 또는 향후 성과에 대한 어떠한 보장도 제공하지 않습니다.
이 작성자의 상품 더 보기


가입일 05/02/2025
30
판매