VIX - volatility indicator - Renko
Indicador
Versão 1.0, Feb 2025
Windows, Mac
Descrição
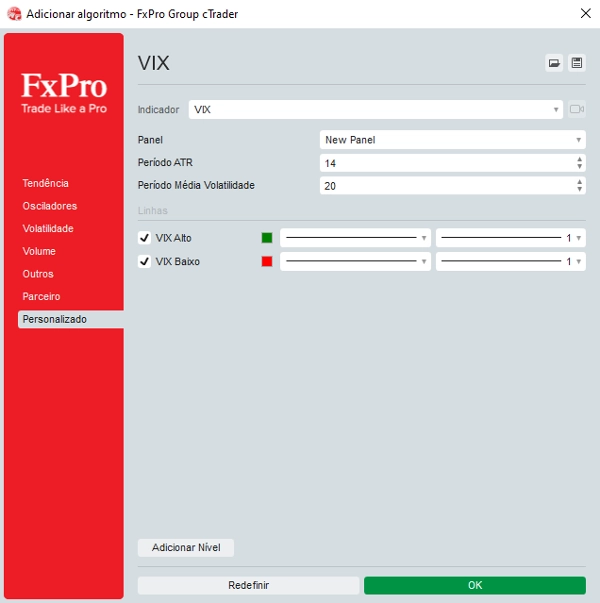
Ajuste os parâmetros: Insira os valores desejados para os níveis LowLevel e HighLevel, e ajuste o Fator de Escala do VIX para que a linha do VIX tenha a altura desejada.
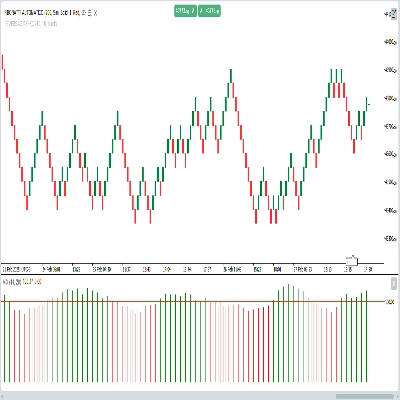
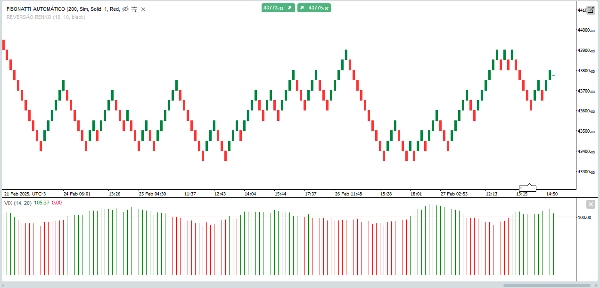
Observe o gráfico:
Quando o VIX ultrapassa o HighLevel e o volume está alto (velas verdes), você pode considerar que há uma ruptura.
Quando o VIX está abaixo do LowLevel, pode indicar um período de baixa volatilidade.
Resumo
Perfil do indicador
Avaliações de clientes
0.0
Avaliações: 0
Avaliações de clientes
Ainda não há avaliações para este produto. Já o experimentou? Seja o primeiro a contar a outras pessoas!
Conversa
Perguntas frequentes
Breakout
Os produtos disponíveis através da cTrader Store, incluindo bots de negociação, indicadores e plugins, são fornecidos por programadores terceiros e são disponibilizados apenas para fins informativos e de acesso técnico. A cTrader Store não é um corretor e não fornece aconselhamento em matéria de investimento, recomendações pessoais ou qualquer garantia de desempenho no futuro.


Preço
Desde 05/02/2025
30
Vendas