
Описание
IR Open Connector
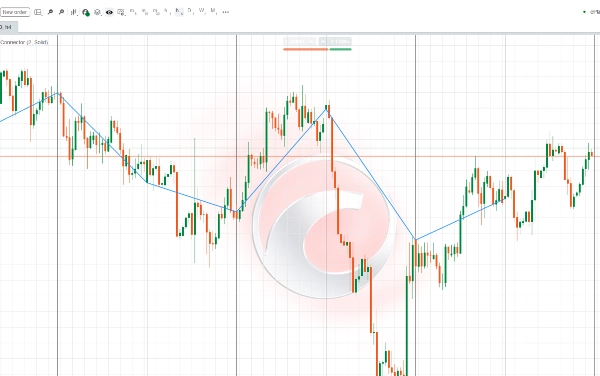
Этот индикатор предназначен для соединения цен открытия свечей более высокого таймфрейма в зависимости от текущего таймфрейма графика:
- Если таймфрейм меньше одного часа → соединяет открытия дневных свечей.
- Если таймфрейм 4 часа → соединяет открытия недельных свечей.
- Если таймфрейм больше 4 часов, но меньше недельного → соединяет открытия месячных свечей.
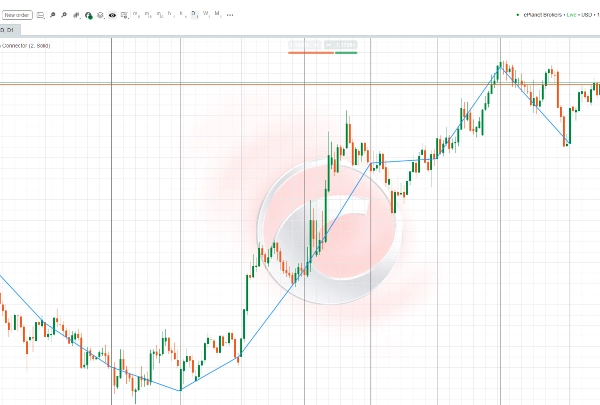
Это позволяет трейдерам чётко визуализировать ключевые уровни открытия более высоких периодов (дневных, недельных, месячных) прямо на их графиках. Эти уровни часто служат критическими зонами поддержки и сопротивления, потенциальными зонами начала тренда и важными ориентирами в рыночном анализе.
Цвет, толщина и стиль линии полностью настраиваются, что даёт вам гибкость адаптировать отображение под ваш личный стиль торговли.
این اندیکاتور طراحی شده تا نقاط باز شدن کندلهای تایمفریمهای بالاتر را بسته به تایمفریم فعلی شما به هم متصل کند:
- اگر تایمفریم کمتر از یک ساعت باشد → باز شدن کندلهای روزانه را به هم وصل میکند.
- اگر تایمفریم چهارساعته باشد → باز شدن کندلهای هفتگی را به هم وصل میکند.
- اگر تایمفریم بزرگتر از چهارساعته و کوچکتر از هفتگی باشد → باز شدن کندلهای ماهانه را به هم وصل میکند.
این ویژگی به معاملهگر کمک میکند تا به سادگی سطوح مهم شروع دورههای بزرگتر (روزانه، هفتگی، ماهانه) را روی نمودار مشاهده کند. این سطوح اغلب بهعنوان نقاط کلیدی حمایت و مقاومت، شروع روندهای جدید یا محدودههای معاملاتی مهم در نظر گرفته میشوند.
با تنظیم رنگ، ضخامت و نوع خط، میتوانید نمایش این خطوط را مطابق با سبک معاملاتی خود شخصیسازی کنید.


