Mô tả
Chỉ báo Pinescriptlabs Store: 🤖Pinescriptlabs Store cBots : (cBot)
PRICE ACTION (Mới)
Gold & BTC BreakoutSession Pivots(mới)
Thuật toán thông minh theo sau(Mới)
Hỗ trợ &
Kháng cự SmartTrend
Đường
Phiên khoảng trống giá trị hợp lý
Phân tích
Cấu trúc thị trường
Động
của
Các điểm xoay chuyển
Fibonacci
Hồi quy tuyến tính
Đa khung thời gian
Đa khung thời gian
Khoảng trống giá trị hợp lý động lực
Theo dõi
Định hướng nến đa cấp
Tracker
Tự động
Hỗ trợ và
Kháng cự
Xu hướng
Đường
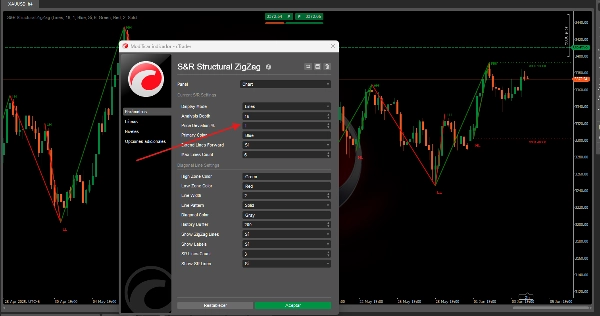
Hỗ trợ & Kháng cự Zig Zag với các dao động
1. Chỉ báo này làm gì? ❓
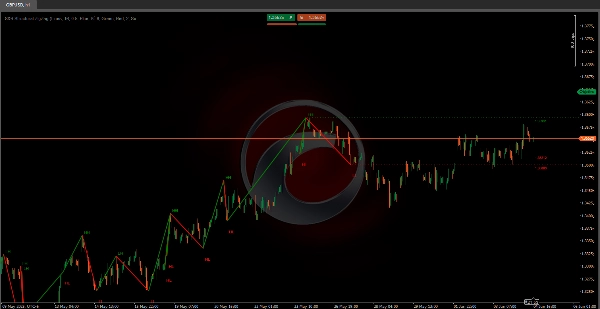
🔍 Phát hiện dao động giá (đỉnh & đáy)
- Quét các thanh gần đây ("Độ sâu phân tích") để tìm giá cao nhất/thấp nhất trong phạm vi đó.
- Xác nhận dao động với ngưỡng phần trăm (ví dụ, thay đổi 1%+ so với dao động trước) → Đánh dấu mới ✅ Đỉnh/Đáy dao động.
- Giảm nhiễu ⚡: Chỉ xác nhận dao động nếu một nửa thời gian phân tích trôi qua mà không có đỉnh cao hơn/đáy thấp hơn.
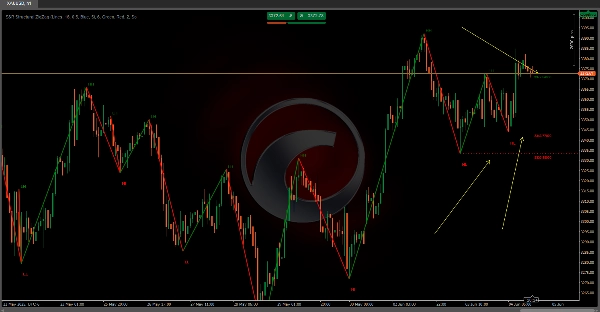
📉 Vẽ các đường xu hướng Zigzag
- Nối các dao động bằng các đường động:
-
- 🟢 Xanh lá = Xu hướng tăng (dao động mới > trước).
- 🔴 Đỏ = Xu hướng giảm (dao động mới < trước).
⏹️ Làm nổi bật các mức quan trọng
- Đường hỗ trợ/kháng cự: Vẽ tại giá chính xác của mỗi dao động, kéo dài sang phải
- Nhãn hiển thị giá 📌 (ví dụ, "1.1050") để phân tích nhanh.
🚦 Tiết lộ cấu trúc thị trường
- Xác định xu hướng ngay lập tức:
-
- Tăng giá = Đỉnh cao hơn (HH) + Đáy cao hơn (HL).
- Giảm giá = Đỉnh thấp hơn (LH) + Đáy thấp hơn (LL).
2. Cách sử dụng (Hướng dẫn cài đặt) ⚙️
Cài đặt trên cTrader: Kéo & thả vào biểu đồ của bạn!
Cài đặt chính:
- Độ sâu phân tích 🔎:
10(mặc định) → Giá trị cao hơn lọc nhiễu; giá trị thấp hơn bắt được nhiều dao động hơn. - Phần trăm lệch giá 📏:
1.0%(có thể điều chỉnh) → Thay đổi giá tối thiểu để xác nhận dao động. - Nhãn dao động 🏷️ (HH/HL/LH/LL): Bật/Tắt.
- Mở rộng đường ➡️: Chiếu các mức Hỗ trợ/Kháng cự vô hạn hoặc giới hạn trong các thanh hiện tại.
Tóm tắt
Đánh giá của khách hàng
5 | 100 % | |
4 | 0 % | |
3 | 0 % | |
2 | 0 % | |
1 | 0 % |


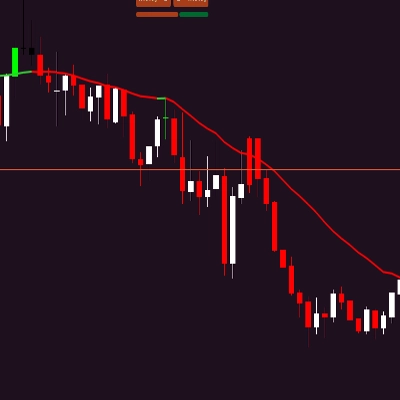
![Logo "[Stellar Strategies] Moving Averages Combined 1.0"](https://cdn.ctrader.com/image/webp/93692c9d-ac16-4dd8-ba83-5a62250c39a9_27250)


![Logo "[Stellar Strategies] Inside Bar with Signals"](https://cdn.ctrader.com/image/webp/1d9e8bfa-3b2c-4440-bb37-5856902008a7_30683)