Deviation Indicator by PrimeQuant
Indicador
Versión 1.0, Oct 2025
Windows, Mac
5.0
Valoraciones: 3
Descripción
- 📈 Qué es
Un conjunto de herramientas profesional que combina canales de Desviación Verdadera, Conceptos de Dinero Inteligente (máximos/mínimos de oscilación y liquidez) y el sesgo de Impulso de Elder para ayudarte a cronometrar reversiones, rupturas de momentum y retrocesos estructurados. - 💡 Por qué a los traders les encanta
- Detecta extremos de alta probabilidad para jugadas de desvanecimiento o continuación
- Mapea estructura (zonas de oscilación) tal como la observan las instituciones
- Destaca niveles de liquidez que a menudo son objetivos antes de movimientos reales
- Agrega un filtro de sesgo de impulso para evitar luchar contra las condiciones de tendencia
- 🧰 Qué obtienes
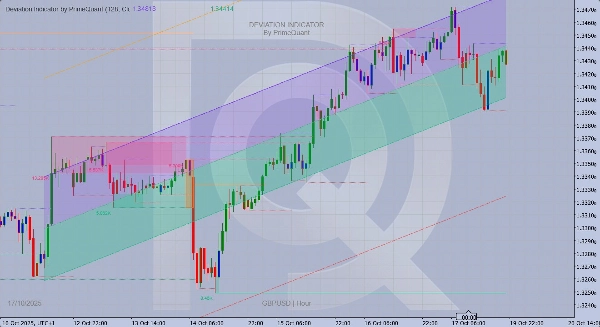
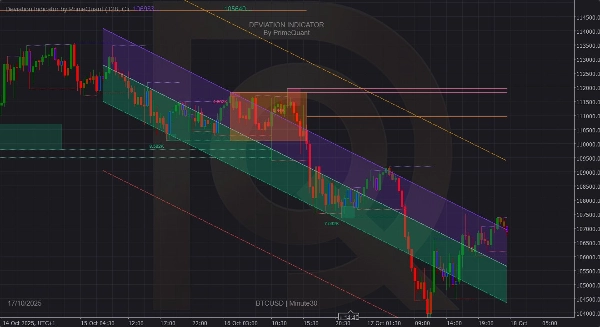
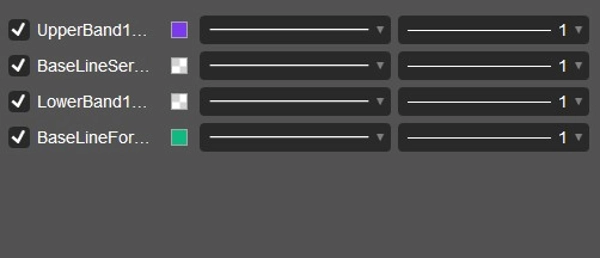
- Canales de Desviación Adaptativos: bandas internas/externas alrededor de una línea base de regresión móvil
- Zonas de Oscilación SMC: máximos/mínimos automáticos de oscilación con rellenos de área opcionales
- Niveles de Liquidez: niveles punteados que rastrean zonas probables de barrido
- Lente de Patrón Riemann: líneas medias dentro de cajas mayores/menores
- Sesgo de Impulso Elder: indicativo visual rápido sobre momentum vs. tendencia
- Paleta Limpia: valores predeterminados modernos y de alto contraste (amigables con temas oscuros y claros)
- Marca de agua e información: marca sutil con lectura de símbolo/marco temporal
- 🧭 Cómo usar (inicio rápido)
- Identificar extremos: El precio toca la desviación externa → busca rechazo o ruptura controlada.
- Confirmar estructura: Revisa las zonas de oscilación cercanas (H/L) y la liquidez—las falsas rupturas son comunes.
- Chequeo de sesgo: Impulso Elder verde/rojo/azul para alinear o mantenerse fuera.
- Planificar la operación:
-
- Reversión: desvanecer la banda externa de vuelta a la línea base o línea media.
- Ruptura: esperar cierre más allá de la banda + cambio de estructura.
- Gestionar riesgo: Colocar stops más allá de oscilación/caja, escalar en línea base o banda opuesta.
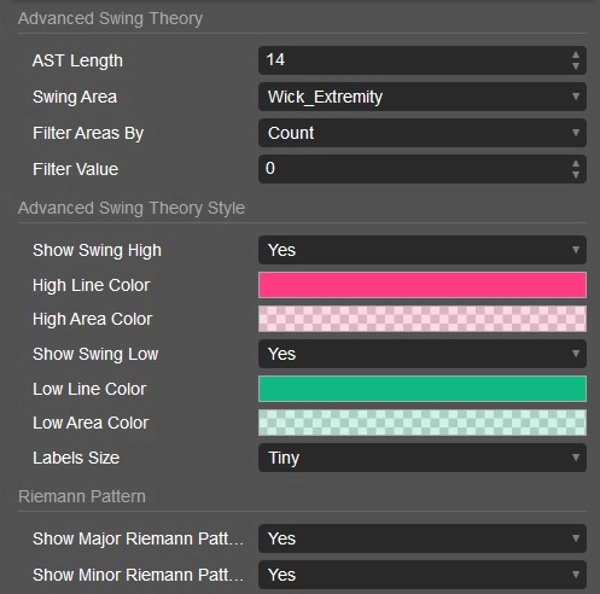
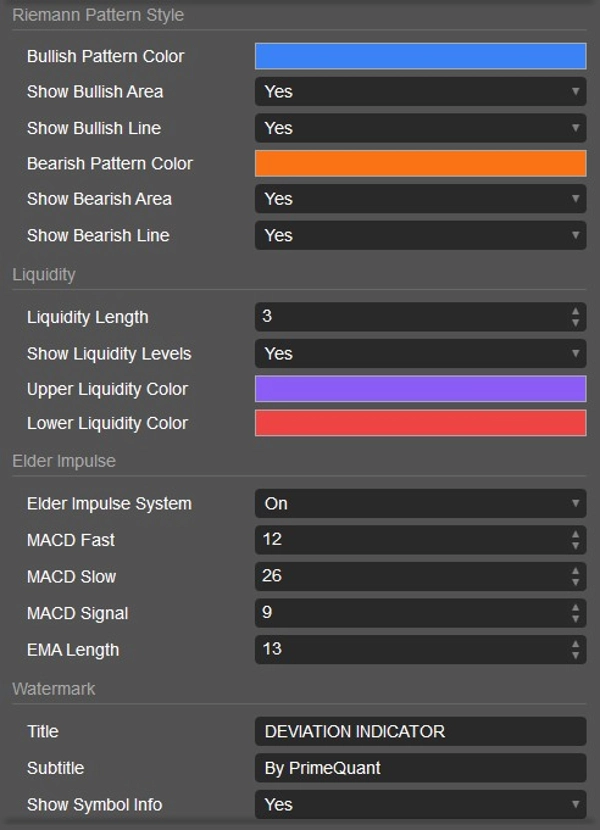
- ⚙️ Parámetros clave
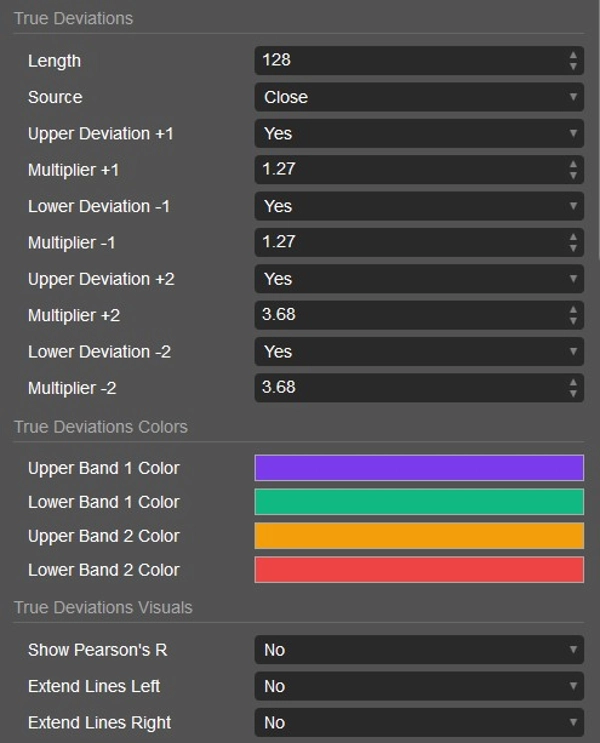
- Longitud: retroceso para regresión y cálculo de desviación (predeterminado 128)
- Fuente: base de precio (Cierre, variantes OHLC)
- Multiplicadores de Desviación: ajustar sensibilidad de bandas internas/externas
- Modo de Área de Oscilación: extremidad de mecha vs rango completo de vela
- Filtros: por conteo de toques o participación de volumen
- Longitud de Liquidez: ancho de pivote para detección de nivel
- Configuraciones de Impulso: entradas MACD/EMA para coloreado de sesgo
- Visuales: colores, rellenos, estilos de línea, texto de marca de agua
- 🧪 Ideas para el libro de jugadas
- Scalp de reversión a la media: toque de banda externa + color de impulso opuesto → objetivo línea base.
- Ruptura de estructura: barrido de liquidez a través de un nivel de oscilación, luego cierre más allá de la banda interna → avanzar hasta la banda externa.
- Retroceso de continuación: impulso verde, retroceso a línea base/banda interna en liquidez previa → reanudación de tendencia.
- 🧭 Funciona en
Forex, Índices, Commodities, Cripto y Acciones; todos los marcos temporales desde scalping hasta swing. - 👤 Para quién es
Traders que quieren un mapa visual único para extremos + estructura + liquidez + sesgo sin desorden. - ⚠️ Aviso legal
Esta es una herramienta de apoyo a la decisión, no un consejo financiero. Siempre prueba en demo y usa una gestión de riesgo estricta.
Resumen
Perfil del indicador
Valoraciones de clientes
5.0
Valoraciones: 3
5 | 100 % | |
4 | 0 % | |
3 | 0 % | |
2 | 0 % | |
1 | 0 % |
Valoraciones de clientes
October 28, 2025
Demo first, then maybe small size if the notes look sane. A small account test feels safer.
October 23, 2025
the only reason it stays interesting is it makes forced ideas less tempting. It needs a boring test before bigger size.
October 20, 2025
RSI 30 and 70 keeps the first run grounded. Thin setups are easier to reject.
Conversación
Preguntas frecuentes
BTCUSD
Forex
Signal
Breakout
Indices
EURUSD
Commodities
GBPUSD
NZDUSD
Fibonacci
Prop
ZigZag
Fair Value Gap
SMC
Crypto
Stocks
XAUUSD
NAS100
MACD
USDJPY
Los productos disponibles a través de cTrader Store, incluidos bots, indicadores y plugins para operar, son proporcionados por desarrolladores de terceros y están disponibles únicamente con fines informativos y de acceso técnico. cTrader Store no es un bróker, por lo que no proporciona asesoramiento de inversión, recomendaciones personales ni ninguna garantía de rentabilidad futura.


Precio
46
Ventas
3.93K
Instalaciones gratis