
Описание
Индикатор ТЕХНИЧЕСКОГО АНАЛИЗА — это продвинутое решение для технического анализа, разработанное для платформы cAlgo, интегрирующее несколько технических индикаторов, ориентированных на выявление устойчивых трендов, рыночного импульса и подтверждения объема. Он сочетает ADX (Средний Направленный Индекс) с анализом наклона, фильтрацией объема и многоиндикаторным техническим анализом в реальном времени, предлагая трейдерам комплексный и надежный взгляд для принятия решений.
🔍 Основная стратегия
1. Основы: ADX + DI (Система направленного движения)
Основой индикатора является ADX (Средний Направленный Индекс), который измеряет силу тренда.
Компоненты +DI (Положительный направленный индикатор) и -DI (Отрицательный направленный индикатор) определяют направление тренда:
+DI > -DI → Восходящий тренд
-DI > +DI → Нисходящий тренд
2. Динамический анализ импульса с помощью наклона
Наклон ADX, +DI и -DI рассчитывается с помощью линейной регрессии.
Это позволяет определить, находится ли тренд в состоянии:
Укрепления (положительный наклон)
Ослабления (отрицательный наклон)
3. Эталонные уровни
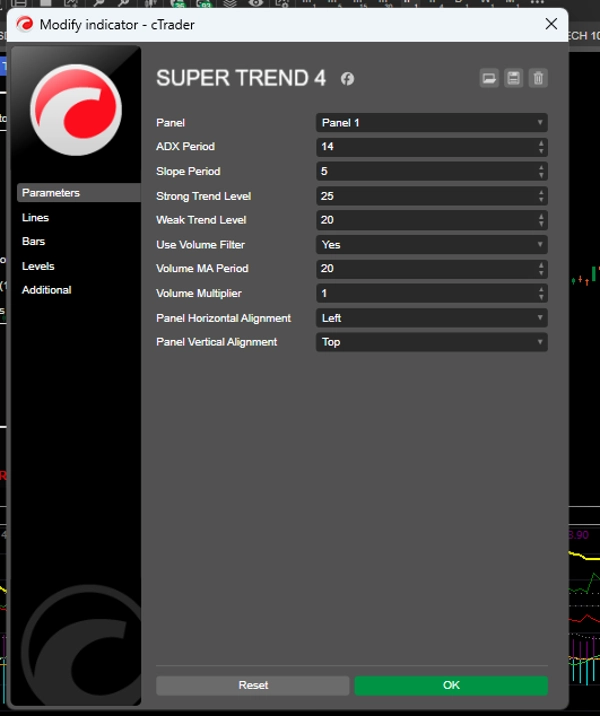
Уровень сильного тренда: уровень, выше которого тренд считается сильным (по умолчанию: 25)
Уровень слабого тренда: минимальный уровень для признания тренда действительным (по умолчанию: 20)
Тренды ниже слабого уровня рассматриваются как боковые или без четкого направления.
📈 Генерация сигналов
Условия для покупки
✅ +DI пересекает сверху -DI
✅ ADX выше уровня слабого тренда (Weak Trend Level)
✅ Положительные наклоны ADX и +DI
✅ Подтверждение объемом (опционально)
Условия для продажи
✅ -DI пересекает сверху +DI
✅ ADX выше уровня слабого тренда (Weak Trend Level)
✅ Положительные наклоны ADX и -DI
✅ Подтверждение объемом (опционально)
Сильные сигналы: когда ADX выше уровня сильного тренда и наклоны значительно положительные, индикатор генерирует усиленные сигналы, избегая повторных последовательных входов. 📊 Фильтр объема (опционально)
Индикатор может требовать подтверждения объемом перед генерацией сигналов.
Текущий объем должен быть больше или равен скользящему среднему объема × множитель.
Это помогает отфильтровывать ложные пробои и сигналы на неликвидных рынках.
🧠 Продвинутый технический анализ (интерактивная панель)
ТЕХНИЧЕСКИЙ АНАЛИЗ включает две интерактивные панели на графике:
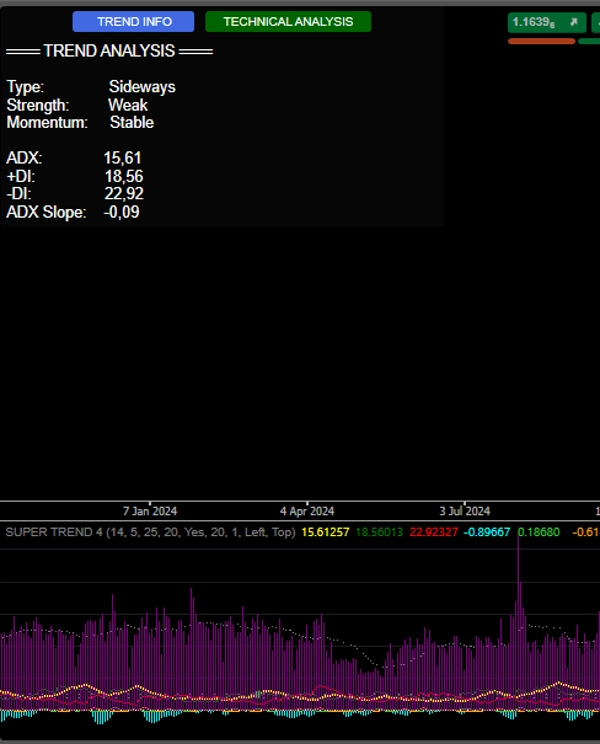
1. ИНФОРМАЦИЯ О ТРЕНДЕ
Тип тренда: Восходящий / Нисходящий / Боковой
Сила тренда: Сильный / Слабый
Импульс: Усиление / Ослабление / Стабильный
Текущие значения ADX, +DI, -DI и наклона
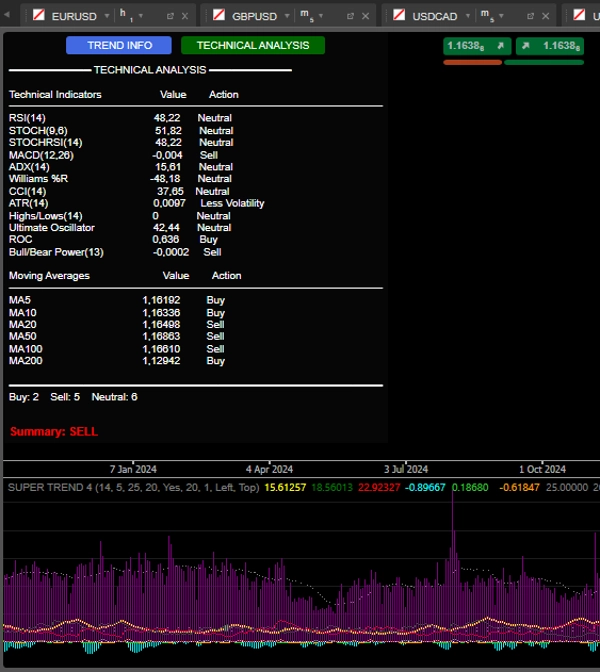
2. ТЕХНИЧЕСКИЙ АНАЛИЗ
Выполняет многоиндикаторный анализ в реальном времени, включая:
RSI(14) – Перекупленность/Перепроданность
Stochastic(14) – Импульс
MACD(12,26) – Пересечения и дивергенции
Williams %R – Рыночные экстремумы
CCI(14) – Отклонения от типичной цены
ROC(12) – Темп изменений
Ultimate Oscillator – Подтверждение силы
Bull/Bear Power – Давление покупателей/продавцов
Скользящие средние (5,10,20,50,100,200) – Долгосрочный тренд
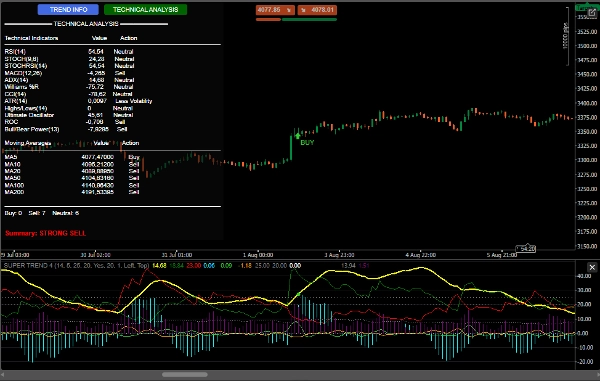
Итоговое резюме: система подсчитывает сигналы покупки/продажи/нейтральные и выдает четкую рекомендацию:
СИЛЬНАЯ ПОКУПКА (≥7 сигналов на покупку)
ПОКУПАТЬ
ПРОДАВАТЬ
СИЛЬНАЯ ПРОДАЖА (≥7 сигналов на продажу)
НЕЙТРАЛЬНО
🔔 Оповещения и визуализация
Визуальные сигналы на графике:
Зеленые/красные стрелки с метками "BUY"/"SELL"
Звуковые уведомления (Windows)
Подробные логи в консоли с:
Временем сигнала
Значениями ADX, DI и объема (если включено)
🛡️ Конкурентные преимущества
✅ Интеграция нескольких индикаторов в одной панели
✅ Фокус на силе и направлении тренда (не только на цене)
✅ Фильтр объема для большей надежности
✅ Интерактивный и информативный интерфейс
✅ Четкие сигналы с визуальными и звуковыми оповещениями