
설명
Pinescriptlabs 스토어 지표: 🤖Pinescriptlabs 스토어 cBots :
ICT Power of 3 (cBot) Gold & BTC BreakoutSession Pivots(new)YieldShield"
SmartTrend Support &
Resistance Lines
Dynamic Market Structure
Analysis of Turning Points
Fibonacci Linear
Regression Multi-timeframe
Multi-Level Candle Bias
Tracker
Auto Support and
Resistance Trend Lines
All Support and
Resistance Levels
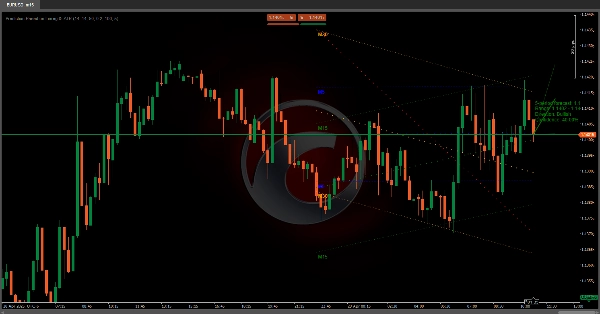
📈 다중 타임프레임 회귀 채널 & ATR 예측 알고리즘
이 시스템은 자산의 잠재적 가격 움직임을 결합하여 예측합니다 다중 타임프레임 추세 분석 📊, 시장 변동성 📉, 그리고 기술 지표 확인 ✅. 목표는 미래 가격 범위 를 측정 가능한 신뢰도로 예측하는 것으로, 높은 확률의 위험-보상 기회를 식별하는 데 이상적입니다 💰.
🔧 단계별 작동 방식
1️⃣ 다중 타임프레임 추세 분석
- 타임프레임별 회귀 채널:
알고리즘은 동시에 네 가지 다른 타임프레임 (단기부터 장기까지)를 분석합니다. 각 타임프레임에 대해: -
- 과거 가격 행동을 기반으로 한 통계적 추세선 을 계산합니다.
- 이 선을 중심으로 예측 채널 을 정의합니다 (과거 변동성을 사용하여 상하한을 설정).
- 계층적 영향력:
짧은 타임프레임이 최종 방향에 더 큰 비중 을 가지며, 최근 움직임에 더 민감함을 반영합니다.
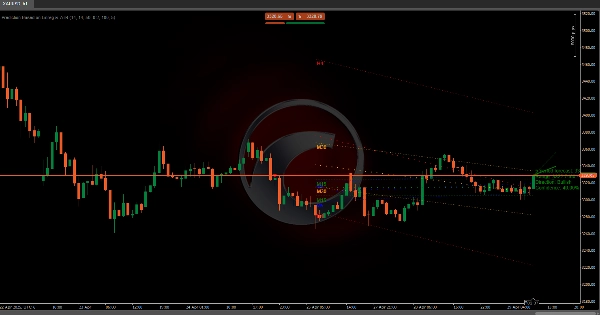
2️⃣ 변동성 통합 (ATR) 🌊
- 동적 변동성 조정:
예측은 현재 시장 상황에 맞게 조정됩니다: -
- 높은 변동성 → 더 넓은 예측 범위
- 낮은 변동성 → 보수적인 조정
- 미래 범위 조정:
예측 밴드는 예상 변동성에 따라 자동으로 조정됩니다.
3️⃣ 추세 확인 시스템 ✅
네 가지 주요 신호를 결합하여 회귀 기반 방향을 검증하거나 도전합니다:
- 이동 평균 교차 (추세 확인)
- 모멘텀 오실레이터 (강도 평가)
- 변동성 지표 (과매수/과매도 탐지)
- 다이버전스 분석 (추세 반전 단서)
- 출력: 점수 시스템 으로 예측된 추세를 강화하거나 의문을 제기합니다.
4️⃣ 신뢰도 계산 🎯
- 타임프레임 정렬:
추세가 타임프레임 간에 일치할 때 신뢰도가 증가합니다. - 사용자 정의 임계값:
트레이더는 최소 신뢰 수준 을 설정하여 높은 확실성 신호만 필터링할 수 있습니다.
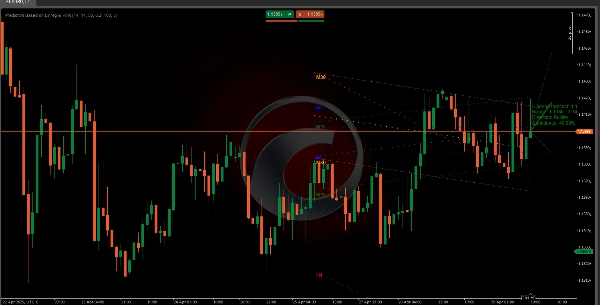
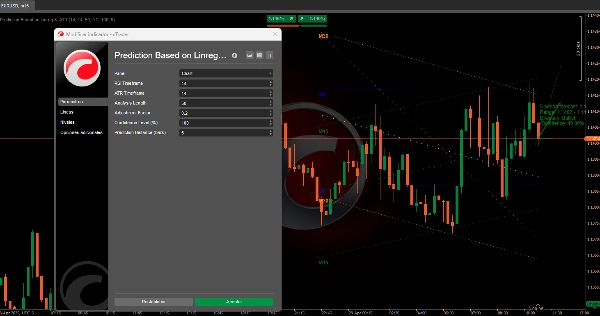
5️⃣ 직관적인 시각화 📉📈
- 예측선:
중앙 예상 경로를 보여줍니다 (녹색 = 강세 🟢, 빨간색 = 약세 🔴, 회색 = 중립 ⚪). - 범위 밴드:
변동성에 맞게 조정된 가장 확률 높은 가격 움직임 구역을 강조합니다. - 정보 라벨:
예상 가격, 범위, 방향 및 신뢰도 수준을 요약합니다.
🌟 주요 장점
- 다차원 접근법: 추세, 변동성 및 모멘텀을 결합하여 거짓 신호를 줄입니다.
- 자동 조정: 변동이 심한 시장이나 추세 시장에 자동으로 적응합니다.
- 투명한 지표: 정량화된 신뢰도는 기대치를 관리하는 데 도움이 됩니다.
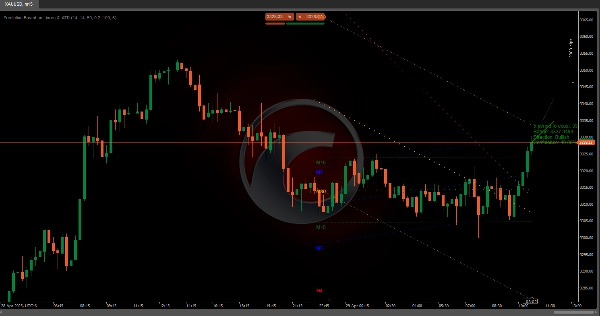
📌 실용적인 예
시스템이 다음을 감지하면:
- 단기 타임프레임에서 강세 추세 + 모멘텀 확인
- 최근 변동성 낮음
- 강한 타임프레임 일치
→ 좁은 밴드와 높은 신뢰도로 가격 상승을 예측합니다 (예: 85%) 🚀
요약
The ATR component dynamically adjusts the prediction bands to current market conditions, widening during high volatility and narrowing during low volatility periods. A trend confirmation system integrates four key signals—moving average crosses, momentum oscillators, volatility indicators, and divergence analysis—to validate or question the regression-based trend, producing a scoring system that indicates trend strength.
Confidence levels are calculated based on alignment of trends across timeframes, with user-configurable thresholds to filter signals by certainty. Visualization includes a central prediction line (color-coded for bullish, bearish, or neutral trends), range bands highlighting probable price zones, and an info label summarizing projected price, range, direction, and confidence.
The indicator supports markets including cryptocurrencies (e.g., BTCUSD), commodities (e.g., XAUUSD), and others. It aims to identify high-probability risk-reward opportunities by combining trend, volatility, and momentum analysis in a self-adjusting, transparent framework.


