
Описание
Система Weis & Wyckoff теперь поддерживает любой график! [Свечи, Тик, Ренко, Диапазон, Хейкин-Аши]
Последнее описание -> 11/11/2025
Система Weis & Wyckoff демонстрирует концепции Дэвида Х. Вайса и Ричарда Уайкоффа
Что нового в Ревизии 1?
- Поддержка графиков [Свечи, Хейкин-Аши, Тик, Диапазон]
- Улучшенная поддержка ZigZag => MTF + режимы [ATR, Процент, Пипсы, NoLag_HighLow]
- Включает все улучшения, связанные с "Order Flow Aggregated"
-
- Пользовательские скользящие средние
- Оптимизация отрисовки
- Фильтры силы (MA/StdDev/Оба)
- Высокопроизводительный VP_Tick()
- Высокопроизводительный GetWicks()
- Асинхронный сбор данных тиков
- Исправление => Панель параметров на MacOS
==========================
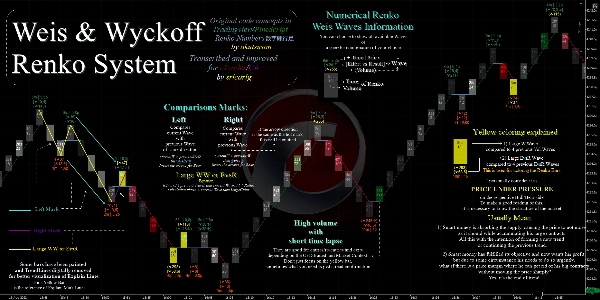
Это просто способ числового визуального отображения волн и объема, это не оригинальная идея.
Вы можете впервые найти этот способ визуализации здесь:
- Дэвид Вайс о Wyckoff | Поддержка/Сопротивление | и Волны,
- Weis on Wyckoff Renko Charts - Линда Рашке (самое свежее)
Это использует концепции кода:
- (Numbers-Renko 数字練行足 в PineScript),
- Благодарности akutsusho!.
Я улучшил это и перенёс в cTrader/C# и это также бесплатно/с открытым исходным кодом.
=========================================
Транскрибировано и улучшено для cTrader/C#
от srlcarlg
Оригинальные концепции кода в TradingView/Pinescript
от akutsusho
=========================================
Всегда предпочитайте версию из магазина cTrader, она обновляется первой.
Все индикаторы которые я разработал являются открытым исходным кодом. Если у вас нет доступа к коду, посмотрите репозиторий на Github
Сводка
Key features include:
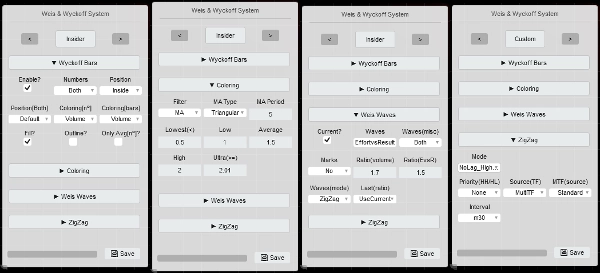
- A versatile Params Panel with four layout templates (Insider, Time, Volume, BigBrain) for quick and user-friendly customization.
- Enhanced ZigZag functionality with multi-timeframe support and multiple modes such as ATR, Percentage, Pips, and NoLag High/Low.
- Integration of order flow aggregation improvements, including custom moving averages, performance drawing, strength filters (MA, StdDev, or both), and high-performance tick volume and wick calculations.
- Dynamic TimeLapse feature showing time waves across various intervals from milliseconds to days.
- Compatibility with Mac OS and requires .NET 6.0 or higher.
The indicator is a C# adaptation and improvement of original PineScript concepts, designed to provide detailed wave and volume visualization without repainting options. It is maintained as open source, with code available on GitHub for transparency and further development.
Отзывы покупателей
5 | 100 % | |
4 | 0 % | |
3 | 0 % | |
2 | 0 % | |
1 | 0 % |


