
Order Flow Ticks v2.0
Индикатор
12.11K скачивания
Версия 1.1, Jan 2026
Windows, Mac
4.4
Отзывы: 23
Описание
Последнее описание -> 11/11/2025
Каждый аспект Order Flow Ticks (агрегированная версия) был тщательно разработан с учетом производительности , чтобы он мог работать даже на менее мощных машинах.
Тем не менее, вот несколько "Советов и Приемов" для лучшего использования:
- Данные тиков хранятся в ОЗУ, хотя cTrader уже имеет хорошее управление памятью:
-
- Загружайте только то, что действительно нужно для живой торговли.
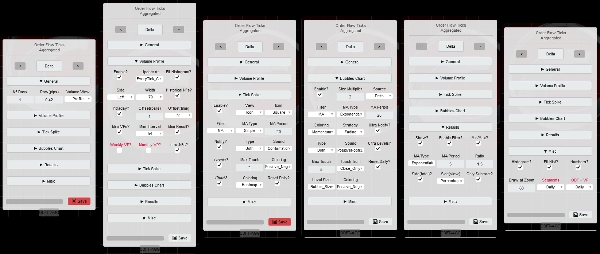
- Панель параметров уже показывает, какие параметры поддерживаются каждым режимом.
- Интервал сегментов может изменить анализ фильтров, используйте Дневной интервал для внутридневного импульса.
- На старших таймфреймах (включая графики на основе цены)
-
- Установите ODF + VP на Еженедельно
- Параметры № дней / Сброс ежедневно? теперь Week/Weekly.
- Все фильтры будут сбрасываться каждую неделю вместо каждого дня.
- "Младший таймфрейм" с "Маленьким размером строки":
-
- Пользовательские скользящие средние созданы для ускорения перерасчета при смене настроек на Панели параметров.
- Если вы хотите использовать скользящие средние cTrader, установите [ODF] Использовать пользовательские скользящие средние? в Ложь
-
- Будьте терпеливы, если активирован любой фильтр [Результаты / Спайк / Пузыри].
- Если требуется высокая производительность:
-
- Отключите Volume Profile и/или используйте Mini-VPs вместо этого. (по умолчанию)
- Используйте "Concurrent" в "[VP] Update Strategy" в "Specific Settings", однако это увеличивает использование ОЗУ. (по умолчанию)
- Используйте "Redraw_Fastest" в настройках "Performance Drawing" (по умолчанию)
- Используйте пользовательские скользящие средние (по умолчанию)
- Любые заполненные и/или текстовые рисунки довольно тяжелы, если их много.
- При бэктестинге некоторые рисунки на графиках на основе цены ломаются, но в реальном времени работают нормально.
- Сохранённые настройки хранятся в "Documents/cAlgo/LocalStorage/ODFT-AGG ..."
Новые функции анализа Order Flow Ticks:
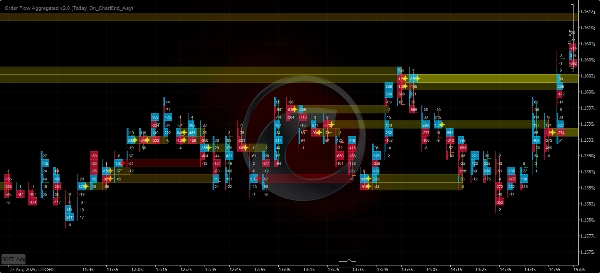
- Фильтр спайков тиков
-
- Скользящая средняя или стандартное отклонение.
- в виде иконок или пузырей.
- Уровни спайков.
- График спайков (пузыри):
-
- Окраска тепловой карты.
- Положительная/отрицательная окраска.
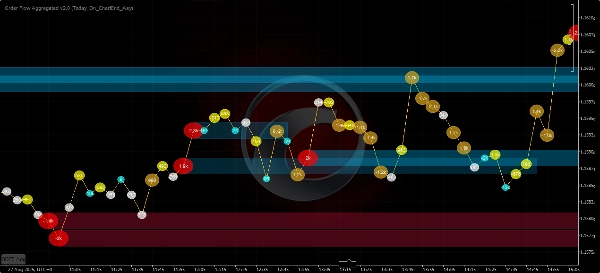
- График пузырей
-
- Скользящие средние, стандартное отклонение или оба варианта.
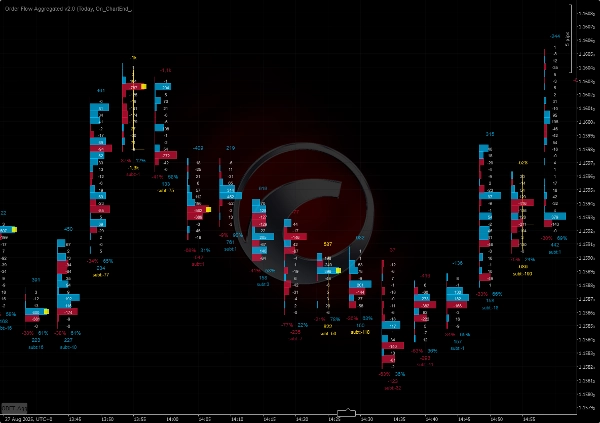
- [Volume Delta / Cumulative Delta Change / Subtract Delta] в качестве источника.
- Ультра уровни пузырей.
- Окраска тепловой карты.
- Окраска импульса:
-
- Затухание
- Положительная/отрицательная
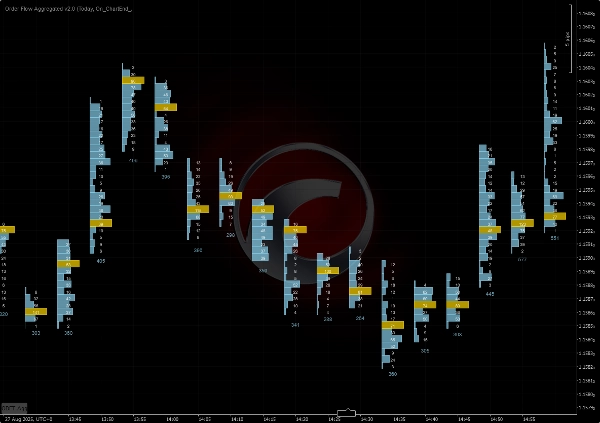
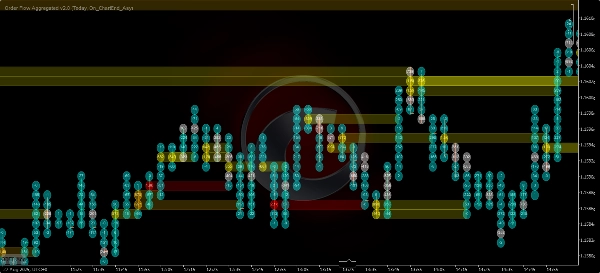
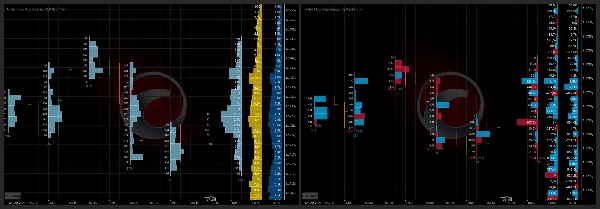
- Volume Profile
-
- Мини-VP - от 5 минут до 1 дня.
- Дневные, еженедельные, ежемесячные профили!
- Профили фиксированного диапазона.
=============================
Всегда предпочитайте версию из магазина cTrader, она обновляется первой.
Все индикаторы которые я разработал являются открытым исходным кодом. Если у вас нет доступа к коду, посмотрите репозиторий на Github
Сводка
ИИ-сводка
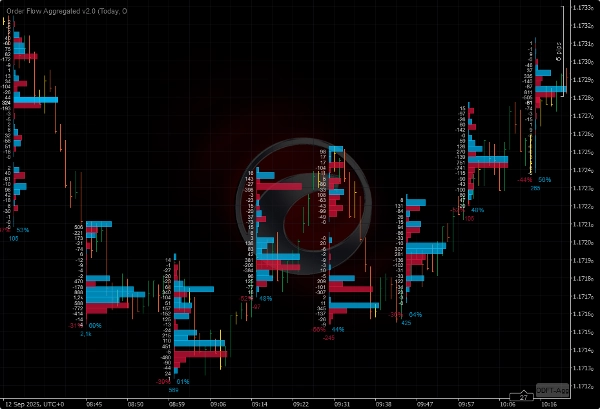
Order Flow Ticks v2.0 is an open-source indicator for the cTrader platform that adapts traditional Order Flow (Footprint) concepts to tick volume data. It supports multiple chart types including ticks, Renko, and range charts. The indicator offers several visualization modes: Normal Mode (volume profile per bar), Buy vs Sell Divided Mode (bid/ask footprint), Buy vs Sell Profile Mode, Delta Divided Mode (delta footprint), and Delta Profile Mode.
Version 2.0 introduces a parameters panel for quick switching between settings such as volume modes and row height, and it uses the Colors API exclusively. It is compatible with Mac OS and requires .NET 6.0 or higher.
Key features include:
- Tick Spike Filter with moving average or standard deviation, displayed as icons or bubbles with heatmap and positive/negative coloring.
- Bubbles Chart showing volume delta, cumulative delta change, or subtract delta with momentum coloring and ultra bubble levels.
- Volume Profile options including mini-profiles from 5 minutes to 1 day, daily, weekly, monthly, and fixed range profiles.
The indicator is optimized for performance to run efficiently on lower-end machines. It stores tick data in RAM and offers settings to balance performance and detail, including custom moving averages and concurrent update strategies. Saved settings are stored locally.
Профиль индикатора
Отзывы покупателей
4.4
Отзывы: 23
5 | 74 % | |
4 | 13 % | |
3 | 4 % | |
2 | 0 % | |
1 | 9 % |
Отзывы покупателей
May 13, 2026
Just a note to say thank you to the creator for making this free of charge. Appreciate it.
March 23, 2026
It's great, Thank you! Can you pls make an update, it doesnt work fully on Indices on CFD
March 9, 2026
"Thank you very much for your work on Order Flow Tick 2.0. It is truly excellent and unique."
October 22, 2025
this is great, i just can't see all the options because the panel is cut short. i don't have access to the bubbles and other features that are apparently there in the code
September 27, 2025
August 3, 2025
Amazing indicator! Once you learn how to use it it really helps out so much, love it!
July 9, 2025
Pros: Real-time tick flow visualization with buy/sell separation. Helps assess market activity and hidden liquidity. Easy to set up, works stable on major assets. Cons: No alerts on tick spikes. No history or tooltips. Requires experience to interpret data correctly.
July 3, 2025
June 20, 2025
Great indicator. It takes a bit of work to learn how to use it properly. Not to be used in isolation, you need to plan potential reversal zones.
April 15, 2025
This looks promising! I tested it out manually, but I would love to automate it! How could we get the source code? :) Really, Pls.
Обсуждение
Частые вопросы
VWAP
Продукты, доступные в cTrader Store, включая торговых ботов, индикаторы и плагины, предоставляются сторонними разработчиками и доступны исключительно в информационных и технических целях. cTrader Store не является брокером и не предоставляет инвестиционные консультации, персональные рекомендации или какие-либо гарантии будущей доходности.


Цена
С 12/12/2024
1
Продажи
33.3K
Бесплатные установки