AbsorptionRatio_AutoRiskPanel
Индикатор
Версия 1.0, Dec 2025
Windows, Mac
5.0
Отзывы: 1
Описание
AbsorptionRatio_AutoRiskPanel преобразует любой символ cTrader в живую панель режима риска 🛰️.
Вместо использования нескольких ETF, как в оригинальном мультиактивном Absorption Ratio, этот индикатор строит прокси AR для одного символа напрямую из ценового движения инструмента, которым вы торгуете:
- 📉 Он вычисляет логарифмические доходности текущего символа.
- 🔗 Он измеряет автокорреляцию доходностей по нескольким лагам (1…7 баров, в зависимости от периода корреляции).
- 📊 Он агрегирует среднее абсолютное значение автокорреляции и отображает его в нормализованном Absorption Ratio от 0.5 до 1.0 — более высокие значения означают большую концентрацию и более плотное поведение.
- 🧬 Он сглаживает исходный сигнал с помощью EMA, создавая стабильную кривую AR.
- 🧪 За скользящим статистическим окном он вычисляет:
-
- среднее и стандартное отклонение AR
- текущий Z-Score (на сколько σ выше/ниже среднего)
- процентильный ранг сегодняшнего AR по сравнению с историей
- 🤖 При включенных Автоматических порогах индикатор непрерывно самокалибрует уровни риска:
-
- Низкий риск ≈
среднее − 0.5σ - Высокий риск ≈
среднее + 0.5σ - Экстремальный риск ≈
среднее + 1.5σ
Значения ограничены диапазоном[0…1]и обновляются по барам, поэтому режимы адаптируются к каждому символу и таймфрейму.
- Низкий риск ≈
- 🧱 Исходя из этих порогов, AbsorptionRatio_AutoRiskPanel определяет четыре динамических режима:
-
- НИЗКИЙ → рассеянный, спокойный / риск-он режим
- НОРМАЛЬНЫЙ → сбалансированные / нейтральные условия
- ВЫСОКИЙ → повышенная кластеризация, тенденции риск-офф
- ЭКСТРЕМАЛЬНЫЙ → стрессовая обстановка, потенциальный всплеск системного риска 🛑
- 🕯️ На основном графике свечи могут быть окрашены по уровню риска:
Это дает вам мгновенный визуальный фильтр: например, торговать входы по тренду только когда свечи не красные/оранжевые, или уменьшать размер позиций во время стрессовых режимов. -
- 🔴 Красный → AR статистически в состоянии стресса (Z-Score ≥ порог)
- 🟢 Лайм → AR статистически спокоен (Z-Score ≤ −порог)
- 🟧 / 🟡 Оранжевый/Желтый → выше высокого / близко к экстремальному
- ⚪ Серый → нейтральная зона
- 💚 Зеленый → низкий AR, более рассеянное / риск-он поведение
- 🎯 Опциональные сигналы возврата к среднему в панели AR:
-
- 🟢 Стрелка покупки когда AR статистически спокоен и начинает расти
- 🔴 Стрелка продажи когда AR статистически в стрессе и начинает снижаться
- 📋 Компактная информационная панель в левом верхнем углу отображает:
-
- текущее значение AR
- активный режим + длительность (количество баров в этом режиме)
- Процентиль, Z-Score и качественный Статус (СТРЕСС / СПОКОЙНО / НОРМАЛЬНО)
- смещение риска (RISK-ON / RISK-OFF / NEUTRAL)
- эффективные пороги Низкий / Высокий / Экстремальный и информация о том, включены ли Автоматические пороги или нет
Используйте AbsorptionRatio_AutoRiskPanel для:
- избегать торговли во время статистически стрессовых, риск-офф режимов
- определять спокойные условия, когда прорывы или следование за трендом могут работать лучше
- контекстуализировать любую стратегию внутри динамической системы режимов риска вместо использования фиксированных фильтров волатильности.
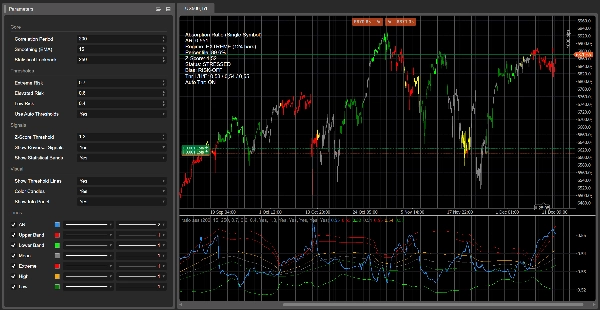
⚙️ Параметры (документация в хранилище)
Основные ⚙️
- Период корреляции – Длина окна автокорреляции. Управляет тем, сколько истории используется для оценки Absorption Ratio. Большие значения = более плавный, «макро» режим; меньшие значения = быстрее, но шумнее.
- Сглаживание (EMA) – Период EMA, применяемый к исходному сигналу AR. Более высокие значения сглаживают изменения режима, более низкие делают индикатор более реактивным.
- Статистическое окно – Период для вычисления среднего, стандартного отклонения, Z-Score и процентиля AR. Определяет, как быстро статистическая база адаптируется.
Пороги 🚦
- Экстремальный риск / Повышенный риск / Низкий риск – Ручные пороги для режимов AR (НИЗКИЙ / НОРМАЛЬНЫЙ / ВЫСОКИЙ / ЭКСТРЕМАЛЬНЫЙ), используемые при выключенных Автоматических порогах. При включенных Автоматических порогах они игнорируются в логике и видны только как значения по умолчанию.
- Использовать Автоматические пороги – При включении пороги выводятся из скользящей статистики AR:
-
- Низкий риск = среднее − 0.5σ
- Повышенный риск = среднее + 0.5σ
- Экстремальный риск = среднее + 1.5σ
Сигналы 🎯
- Порог Z-Score – Минимальное абсолютное значение Z-Score для классификации AR как статистически экстремального. Определяет метки СТРЕСС/СПОКОЙСТВИЕ, переопределения свечей и стрелки возврата к среднему.
- Показывать сигналы разворота – Включает/выключает стрелки ПОКУПКА/ПРОДАЖА в подокне AR.
- Показывать статистические полосы – Переключает полосы ±2σ и линию среднего вокруг AR.
Визуализация 🎨
- Показывать линии порогов – Показывает эффективные уровни Низкий / Высокий / Экстремальный, используемые движком режимов (ручные или автоматические).
- Окрашивать свечи – Окрашивает свечи цены в зависимости от Z-Score и уровня режима для мгновенной визуализации риска.
- Показывать информационную панель – Отображает текстовую панель в левом верхнем углу с AR, режимом, статистикой и смещением.
Сводка
Профиль индикатора
Отзывы покупателей
5.0
Отзывы: 1
5 | 100 % | |
4 | 0 % | |
3 | 0 % | |
2 | 0 % | |
1 | 0 % |
Отзывы покупателей
December 20, 2025
the cleanest use is it makes weak ideas easier to leave alone, and It should stay in the support stack.
Обсуждение
Частые вопросы
Signal
Indices
Commodities
GBPUSD
RSI
Bollinger
Fibonacci
Scalping
AI
XAUUSD
NAS100
MACD
BTCUSD
Forex
Breakout
EURUSD
NZDUSD
Martingale
Prop
ZigZag
Supertrend
Fair Value Gap
SMC
Crypto
Grid
Stocks
ATR
USDJPY
VWAP
Продукты, доступные в cTrader Store, включая торговых ботов, индикаторы и плагины, предоставляются сторонними разработчиками и доступны исключительно в информационных и технических целях. cTrader Store не является брокером и не предоставляет инвестиционные консультации, персональные рекомендации или какие-либо гарантии будущей доходности.


Цена
42.11M
Торгуемый объем
6.13M
Выигранные пипы
224
Продажи
8.42K
Бесплатные установки