present
Daftar dan dapatkan diskon $50 untuk pembelian pertama Anda
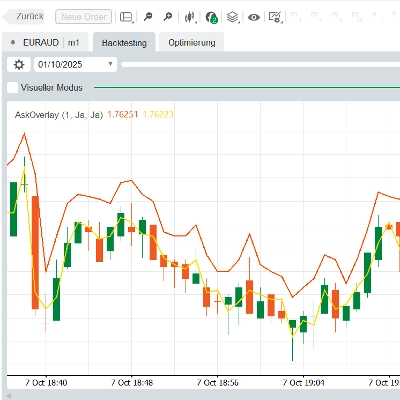
Trading product for AskOverlay Indikator Market Structure, image 1
AskOverlay
Indikator
Versi 1.0, Apr 2026
Windows, Mac
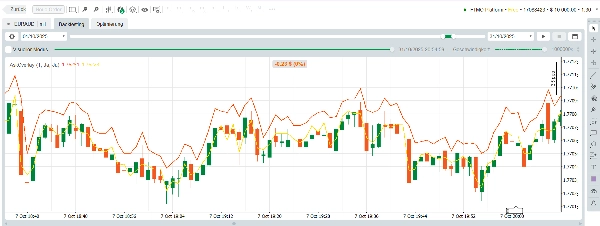
Trading product for AskOverlay Indikator Market Structure, image 2
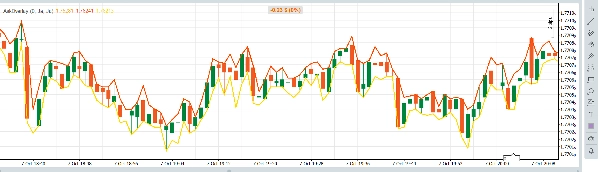
Trading product for AskOverlay Indikator Market Structure, image 3
Sejak 07/04/2026

Deskripsi

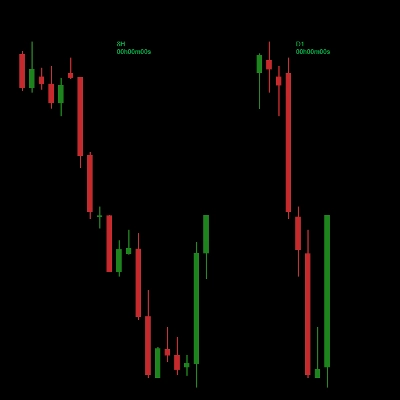
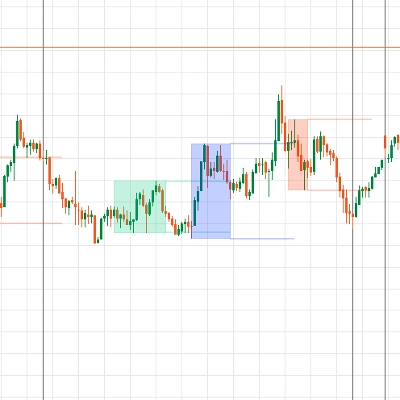
This indicator draws Ask-based High and Low price lines as an overlay on any chart. Since cTrader stores all historical bars as Bid prices, the Ask lines are calculated by adding a fixed spread to the Bid High and Bid Low of each bar.


Parameters:

- Spread Override (Pips): The spread value to add to each bar. Set this to the typical spread of your broker for the symbol you are analyzing. A value of 0 uses the current live spread, which is not historically accurate and not recommended for backtesting analysis.

- Show Ask High: Toggles the Ask High line.

- Show Ask Low: Toggles the Ask Low line.


Limitations:

Historical Ask prices are not available through the cTrader indicator API. There is no historical spread series exposed to indicators, only to cBots running in OnTick. This means the spread applied to all historical bars is a fixed approximation, not the actual spread that existed at the time each bar formed.


Use cases:

Best applied if you only need an 1. average added or 2. you want to visually backtest certain trades from your algo to check e.g. if Ask-Price would be hit.

An easy way to get the spread is via comment in your trade order:

string comment = string.Format("Spread:{0:F1}", Symbol.Spread);


The current live bar uses the real-time Symbol.Ask value from the broker feed, which is accurate.

Ringkasan

Profil indikator

Diskusi

Ulasan pelanggan

0.0
Ulasan: 0
Ulasan pelanggan
Belum ada ulasan untuk produk ini. Sudah mencobanya? Jadilah pemberi ulasan pertama!

Pertanyaan umum

Market Structure
Produk-produk yang tersedia melalui cTrader Store, termasuk bot trading, indikator, dan plugin, disediakan oleh pengembang pihak ketiga serta hanya ditujukan untuk akses teknis dan informasi. cTrader Store bukan broker dan tidak menyediakan saran investasi, rekomendasi pribadi, atau jaminan apa pun tentang kinerja di masa mendatang.

Anda mungkin juga suka

Indikator
SMC
Prop
+4
📈 Trading Sessions Indicator — London, New York & Tokyo Visualize Key Market Sessions + High/Low Levels with Precision
Indikator
Volume
Order Block
+3
Map market structure, order blocks, liquidity and key zones with an interactive cTrader dashboard.
Indikator
AI
ATR
+26
Session Volume Profile + Composite. POC/VAH/VAL, Focus/Solo. Fast, clean, no ghosts, live-ready.
Indikator
AI
Forex
+5
Dynamic, color‑coded candles reveal market shifts instantly—spot momentum and trend reversals at a glance
Indikator
EMA
AI-assisted
+1
Multi EMA Timeframes lets you stay on your chart and see the exact EMA from any timeframe you choose — up to 5 at once.
Indikator
Key Levels
Trend-filtered signals, transparent trade plans and a multi-timeframe decision panel for cTrader.
Indikator
Supertrend
Moving Average
Easy Trade: Trend & Breakout Indicator for cTrader
Indikator
SMC
Prop
+13
Perfect for traders who demand a clear overview of multiple timeframes at a glance.
Indikator
Forex
BTCUSD
+5
Simple ICT Concepts
Indikator
ATR
EMA
+5
Candle timer with live profit tracking on chart – displays pips, currency value, and percentage in real time.
Indikator
ATR
MSS
+5
Advanced market structure and institutional cycle mapper with visual reference cards and entry alerts
Indikator
Volume
Imbalance
+1
Volume profile indicator that auto-detects the latest trendline. Shows POC, Value Area (VAH/VAL), and High Volume Nodes
Indikator
Prop
Forex
+12
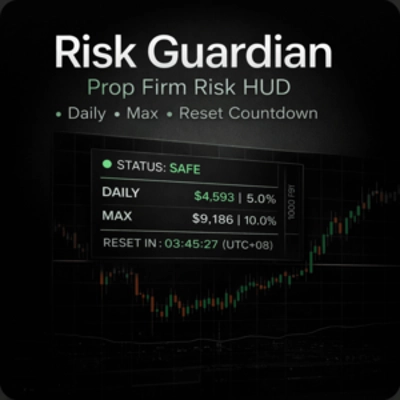
A clean, real-time risk HUD designed to prevent prop firm account failure and protect your challenge account.
Indikator
VWAP
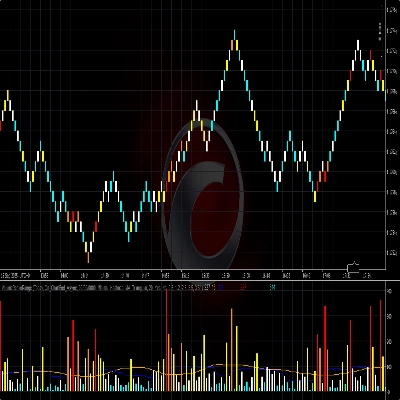
Volume for Renko/Range
Indikator
SMC
Prop
+15
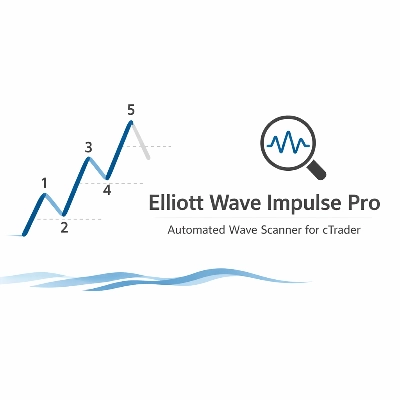
Automatic Elliott Wave Detection with Professional Filters
Indikator
BOS
Imbalance
+4
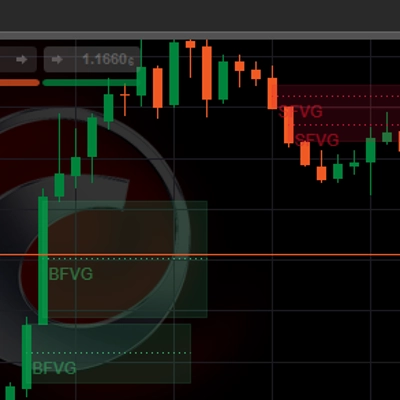
Automatically detects and highlights both Bullish and Bearish Fair Value Gaps (FVGs).
Indikator
AI
ATR
+27
Daily TPO profile indicator that calculates POC, VAH and VAL for each session. Plots the Point of Control and the 70% Va
Indikator
BOS
MSS
+2
Stay ahead with a real-time countdown to candle closes on all key timeframes: 5m, 15m, 30m, 1H, 4H, and Daily.

Harga

Sejak 07/04/2026