说明
趋势线振荡器Trendlines Oscillator 帮助交易者基于当前价格与最近检测到的看涨和看跌趋势线之间的归一化距离识别趋势和动量。
该指标具有看涨和看跌动量、带交叉的信号线以及多种平滑选项。
使用方法
Trendlines Oscillator 通过系统地执行以下操作:
- 识别枢轴高点和低点。
- 连接枢轴点形成看涨(支撑)和看跌(阻力)趋势线。
- 测量当前价格与这些趋势线之间的距离(差值)。
- 将这些距离归一化到0到100之间,以创建动量值。
- 对数值进行平滑处理以获得更清晰的信号。
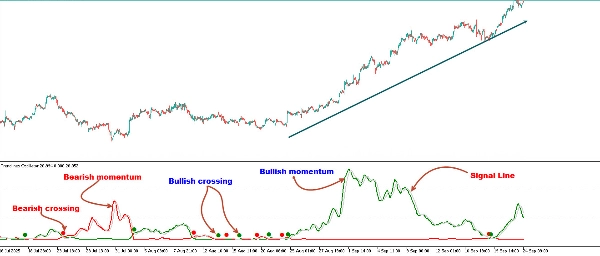
- 当动量线与信号线交叉时,生成看涨和看跌信号。
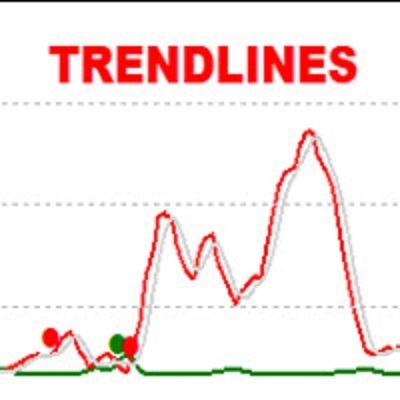
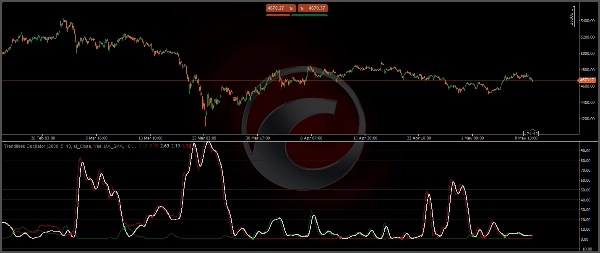
振荡器显示三条关键线:
看涨动量线(绿色):通过计算价格距离最近看涨支撑趋势线的远近来衡量买方力量。
看跌动量线(红色):通过计算价格距离最近看跌阻力趋势线的远近来衡量卖方力量。
信号线(灰色):与动量线交叉,突出潜在的交易机会。
一般来说,当看涨动量线高于看跌动量线时,表示买方力量强。这意味着实际价格距离支撑趋势线比阻力趋势线更远。卖方力量则相反。
计算看涨动量时,工具首先识别作为价格下方支撑的看涨趋势线。然后测量价格与这些趋势线之间的差值,并将读数归一化为显示的动量值。
看跌动量的计算过程相同,但使用的是作为价格上方阻力的看跌趋势线。
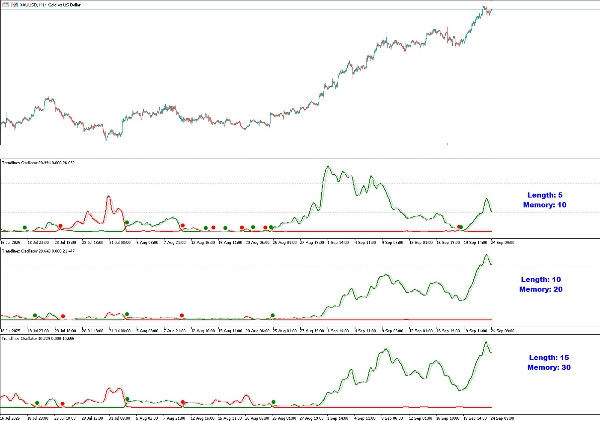
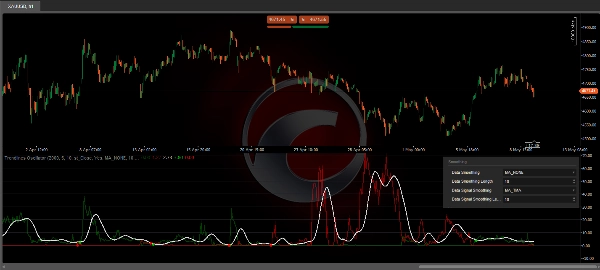
长度与记忆
- 长度:决定用于检测趋势线的市场结构大小。较大的值捕捉更广泛的趋势,而较小的值使工具对短期波动更敏感。
- 记忆:控制计算中考虑的趋势线数量。较高的记忆值平滑信号以便长期分析,较小的记忆值则提供更快的反应。
修改长度和记忆值会导致工具显示不同的动量值。
交易者可以调整长度以检测更大的趋势线,调整记忆以指示工具应考虑多少条趋势线。
如上图所示,较小的值使工具更灵敏,而较大的值适合检测更大的趋势。
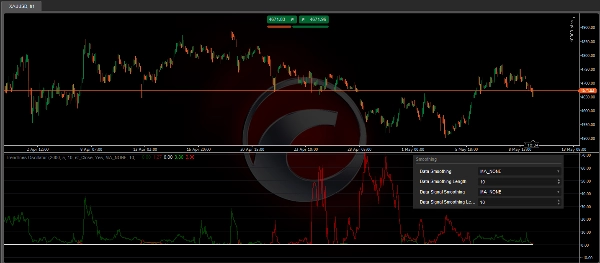
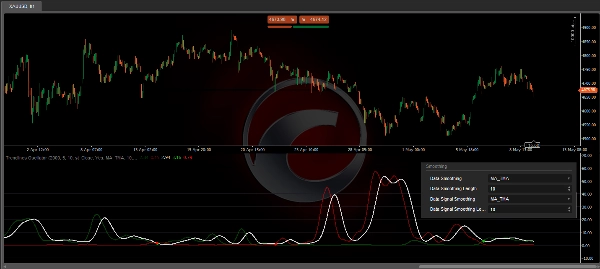
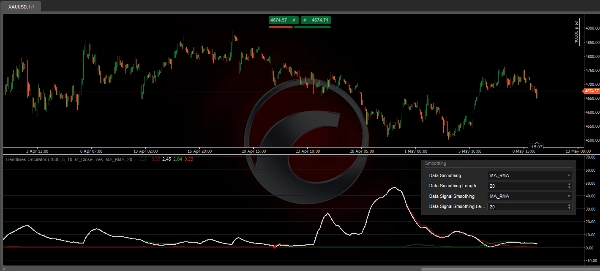
平滑处理
- 数据平滑:对原始动量值应用平滑处理。
- 信号平滑:对信号线本身进行平滑处理,以获得更清晰的交叉点。
默认情况下,数据通过简单移动平均(SMA)进行平滑,信号线使用长度为10的三角移动平均。交易者可以对数据和信号线都进行平滑处理。
交易者可以选择不同的方法,或者不使用平滑。附加图片中展示了一些示例。
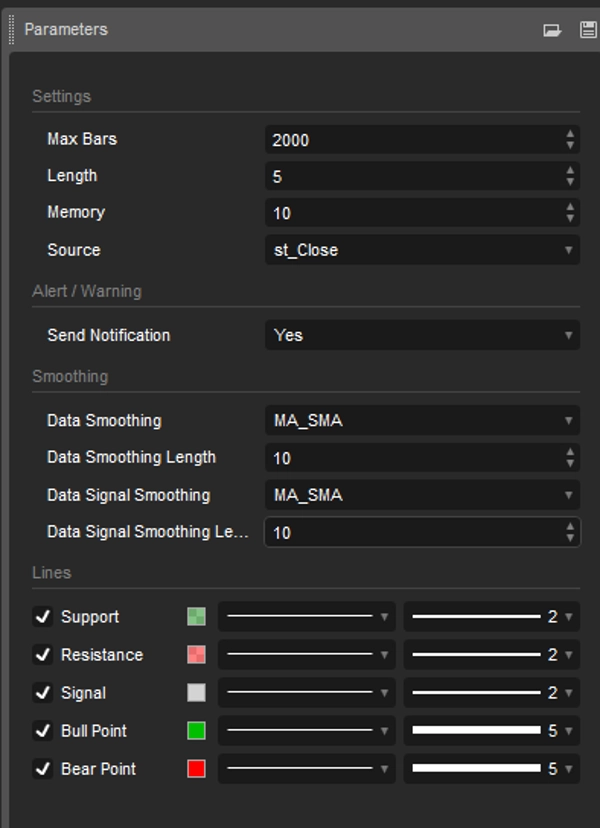
设置
- 长度:用于趋势线检测的市场结构大小。
- 记忆:计算中使用的趋势线数量。
- 来源:默认情况下,计算使用收盘价作为数据来源。
- 数据平滑:选择平滑方法和长度
- 信号平滑:选择平滑方法和长度
- 警报:当看涨/看跌交叉时发出警报/通知
- 样式:调整支撑/阻力/信号线的颜色、样式和宽度
趋势线振荡器交易指标非常适合希望:
- 基于趋势线的动量视图,而不仅仅依赖移动平均线或相对强弱指数(RSI)。
- 清晰的视觉交叉信号,以指示潜在的进出场点。
- 可自定义的平滑处理,以适应不同的交易风格。
- 实时突出买方与卖方的主导地位的工具。
- 通过结合结构性市场分析与动量计算,该工具在识别趋势延续和反转机会方面提供独特优势。
摘要
AI 摘要
The Trendlines Oscillator is a trading indicator designed to identify market trends and momentum by analyzing the normalized distances between the current price and recently detected bullish (support) and bearish (resistance) trendlines. It operates by detecting pivot highs and lows, connecting these to form trendlines, measuring the price distance from these lines, and normalizing the results into momentum values between 0 and 100. The indicator features three key lines: a Bullish Momentum Line (green) indicating buyer strength, a Bearish Momentum Line (red) indicating seller strength, and a Signal Line (gray) that highlights potential trading opportunities through crossovers with the momentum lines.
Users can customize the indicator’s sensitivity and responsiveness by adjusting the Length (market structure size for trendline detection) and Memory (number of trendlines considered). The tool also offers data and signal smoothing options using various methods, including SMA and triangular moving averages, to provide clearer signals. The Trendlines Oscillator supports alerts for bullish and bearish crossovers and allows customization of line styles and colors. It provides a structural market analysis combined with momentum calculations to help traders assess buyer versus seller dominance and identify trend continuation or reversal opportunities.
Users can customize the indicator’s sensitivity and responsiveness by adjusting the Length (market structure size for trendline detection) and Memory (number of trendlines considered). The tool also offers data and signal smoothing options using various methods, including SMA and triangular moving averages, to provide clearer signals. The Trendlines Oscillator supports alerts for bullish and bearish crossovers and allows customization of line styles and colors. It provides a structural market analysis combined with momentum calculations to help traders assess buyer versus seller dominance and identify trend continuation or reversal opportunities.
指标配置
指标分类
趋势
输出类型
信号
数据要求
仅 K 线
支持的信号
波动性
客户评价
0.0
评价:0
客户评价
该产品尚无评价。已经试过了?抢先告诉其他人!
讨论
常见问答
EMA
SMA
Market Structure
ATR
Moving Average
Support & Resistance
cTrader Store 提供的所有产品,包括交易机器人、指标和插件,均由第三方开发者提供,仅供信息参考和技术访问之用。cTrader Store 并非经纪商,不提供投资建议、个人推荐或任何未来业绩保证。
该作者的其他作品


价格
38
销售
2.35K
免费安装