present
Daftar dan dapatkan diskon $50 untuk pembelian pertama Anda
Trading product for Trend Swing Radar Indikator Key Levels Market Structure, image 1
Trend Swing Radar
Indikator
Versi 1.0, Jul 2026
Windows, Mac
Trading product for Trend Swing Radar Indikator Key Levels Market Structure, image 2
Trading product for Trend Swing Radar Indikator Key Levels Market Structure, image 3
Trading product for Trend Swing Radar Indikator Key Levels Market Structure, image 4
Sejak 08/07/2026

Deskripsi

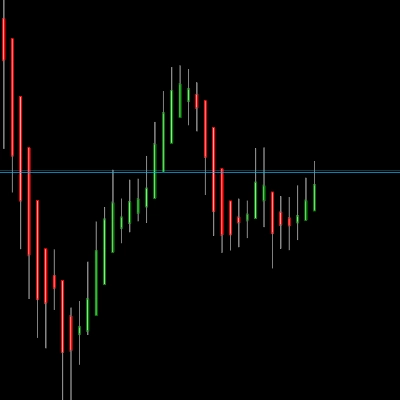
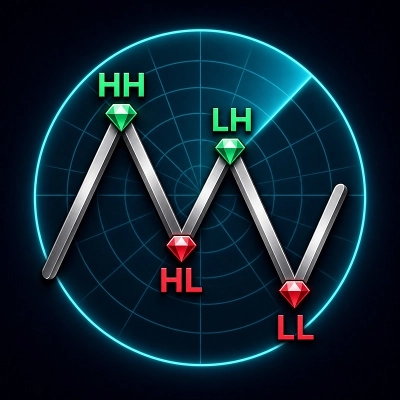
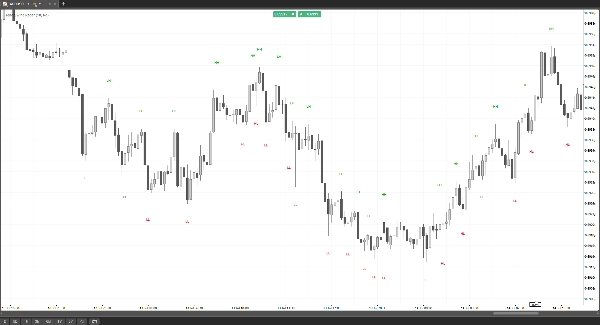
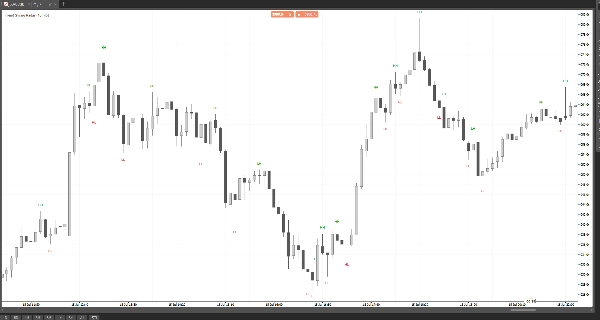
Trend Swing Radar is a visual-only indicator that dynamically follows the active price feed and identifies major Higher High (HH), Higher Low (HL), Lower High (LH) and Lower Low (LL) swing points directly on the cTrader chart.


It is intended exclusively for manual chart analysis and discretionary trading. It is not designed to provide trading signals or numerical data to cBots, automated strategies or other indicators.


Its swing and pullback engine analyses each candle price delivery directly. It does not depend on moving averages, oscillators or other lagging technical indicators to identify swings and structural changes.


Trend Swing Radar is designed for discretionary traders who want to understand price structure without lagging indicators, signal panels or unnecessary chart clutter. It prints clean labels above and below the corresponding swing points, helping traders follow bullish and bearish markets across multiple timeframes and assets.


Key features:


- Automatically identifies HH, HL, LH and LL swing structure

- Dynamically evaluates the active market data feed

- Uses direct candle price delivery instead of lagging technical indicators

- Clean label-only display with no connecting swing lines

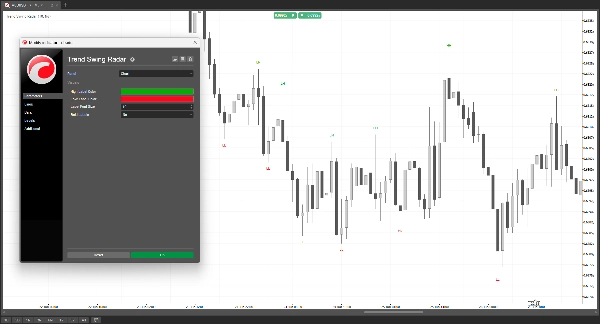
- Customizable label colors, font size and bold style

- No automated trading, alerts or numerical output series

- Intended for manual trading only; no cBot integration or machine-readable signal output

- Requires no file access, network access or Full Access permission


The indicator can be used on forex pairs, metals, indices and other instruments with reliable candle data. Typical uses include trend assessment, pullback analysis, swing identification and adding market context to an existing discretionary trading strategy.


Because the indicator follows the active price feed, developing structure on the currently forming candle may update as prices change. Historical results may also differ between brokers due to differences in candle data and available history.


Trend Swing Radar is a visual analysis tool and does not provide financial advice or guarantee future price direction or trading profitability.

Ringkasan

Profil indikator
Kategori indikator
Tren
Tipe output
Visualisasi
Persyaratan data
Hanya batang

Diskusi

Ulasan pelanggan

0.0
Ulasan: 0
Ulasan pelanggan
Belum ada ulasan untuk produk ini. Sudah mencobanya? Jadilah pemberi ulasan pertama!

Pertanyaan umum

Key Levels
Market Structure
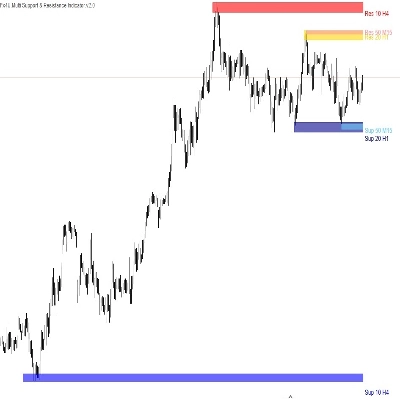
Support & Resistance
Produk-produk yang tersedia melalui cTrader Store, termasuk bot trading, indikator, dan plugin, disediakan oleh pengembang pihak ketiga serta hanya ditujukan untuk akses teknis dan informasi. cTrader Store bukan broker dan tidak menyediakan saran investasi, rekomendasi pribadi, atau jaminan apa pun tentang kinerja di masa mendatang.

Anda mungkin juga suka

Indikator
Breakout
Allow trader to visualize Support & Resistance across different timeframes,give trader an overview of the current market
Indikator
VWAP
Volume
+5
Multi VWAP. Three timeframes. One clean chart. Your Essential Trading Tool.
Indikator
SMC
VWAP
+4
Killzone Session and key levels with VWAP – Precision Meets Price Action
Indikator
ATR
RSI
+5
🚀 HAI QUANTUM v4.0 | The Ultimate Quantum Terminal for cTrader (Smart Money & Algorithmic Trading)
Indikator
AI
ATR
+27
Smart Money Gaps: MTF FVG auto-detection, extension, and mitigation marker. Trade institutional imbalances.
Logo "Cross EMA Pro"
Peringkat teratas
4.4
(5)
$49
Indikator
Forex
BTCUSD
+5
Cross EMA Pro – Trend Reversal Indicator
Indikator
VWAP
Volume
+3
Don't trust static support and resistance levels, this indicator combines Fibonacci and VWAP in one powerful tool.
Indikator
AI
Grid
+17
Clean 3D, Sleek Candles for Trend Patterns.
Indikator
Doji
Wedge
+5
Angora Pattern Recognition is a cTrader indicator that finds, draws and tracks classic chart patterns automatically.
Indikator
SMC
Prop
+14
Right-anchored cTrader Volume Profile with VAH/VAL/POC, LVZ, top volume+EMA, themes, and fast, readable visuals.
Indikator
ATR
EMA
+4
Range-filter BUY/SELL signals scored by four confluence layers, with a stop, five targets and a trend panel
Indikator
RSI
Signal
+1
Multi-timeframe version of the Quantitative Qualitative Estimation (QQE) indicator.
Indikator
Drawdown Monitor
Protect your funded account. Real-time Daily Equity Drawdown monitor with Green / Orange / Red flashing alerts.
Indikator
ATR
Key Levels
+1
Explore 88 harmonic price-pattern variants with interactive chart controls and geometric reference levels.
Indikator
Forex
EURUSD
+7
Institutional Session Levels Pro OHLC,Prev(D,W,M OHLC)
Indikator
SMC
Prop
+9
PDL/PDH/PWL/PWH and Session higs/lows (customizable)
Indikator
Key Levels
Trend-filtered signals, transparent trade plans and a multi-timeframe decision panel for cTrader.
Indikator
ATR
RSI
+2
This indicator works best as a trend-confirmation tool—wait for multiple signals!

Harga

Sejak 08/07/2026