

Описание
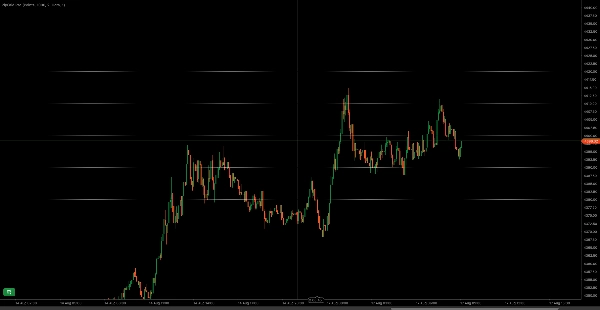
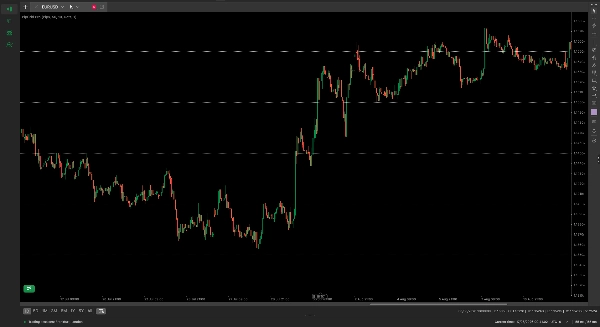
PipGrid Pro автоматически строит чистые, ненавязчивые горизонтальные уровни цен, откалиброванные под вашу точную торговую стратегию, не загромождая ваши графики.
Институциональный поток ордеров, размещение стопов и цели тейк-профита постоянно группируются вокруг психологически значимых круглых чисел и крупных значений. В то время как универсальные скрипты ломаются при переключении между инструментами, часто рисуя линии за тысячи пунктов на золоте или криптовалютах, PipGrid Pro нативно считывает спецификации тиков и пунктов брокера для обеспечения математически точного расстояния между уровнями на любом символе.
Ключевые особенности
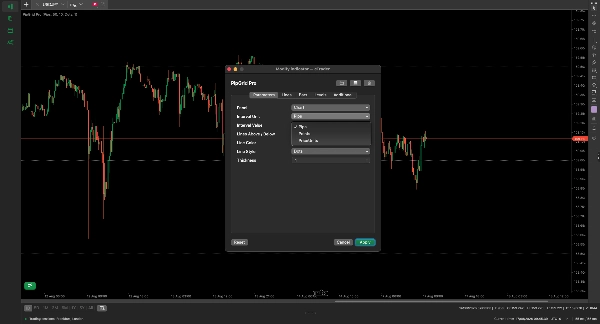
- Универсальная калибровка символов: Легко переключайтесь между пунктами (Pips), брокерскими пунктами (Broker Points) и ценовыми единицами (Price Units) для точного масштабирования на Forex, металлах (XAUUSD), индексах и криптовалютах.
- Безопасное пространство имён объектов: Рисует исключительно под изолированным идентификатором RNL_. Никогда не перезапишет, не изменит и не удалит ваши ручные рисунки на графике, уровни Фибоначчи или сторонние индикаторы.
- Динамическое отслеживание диапазона: Автоматически центрирует и обновляет видимое окно сетки по мере движения рыночной цены.
- Полная визуальная настройка: Настраивайте цвета линий, стили (Сплошные, Точки, Линии, Линии с точками) и толщину, чтобы соответствовать любой тёмной или светлой теме графика.
- Лёгкое исполнение: Отсутствие задержек в производительности; вычисления выполняются строго при проверках границ живого бара.
Настройки параметров
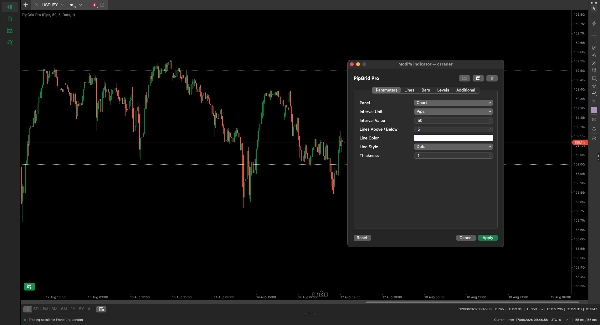
- Единица интервала (по умолчанию: пункты) — Выберите режим расчёта между пунктами, брокерскими пунктами или ценовыми единицами для точной калибровки актива.
- Значение интервала (по умолчанию: 10.0) — Точное расстояние шага между каждой горизонтальной линией сетки.
- Линий сверху / снизу (по умолчанию: 20) — Общее количество уровней сетки, построенных выше и ниже текущей рыночной цены.
- Цвет линии (по умолчанию: серый) — Визуальный цвет построенных линий сетки.
- Стиль линии (по умолчанию: точки) — Визуальный узор линий (Сплошные, Точки, Линии, Линии с точками).
- Толщина (по умолчанию: 1) — Толщина штриха горизонтальных линий (значения от 1 до 5).
Рекомендуемые настройки активов
- Forex (EURUSD, GBPUSD): Установите единицу в пункты (Pips) с интервалом 50 или 100 для институциональных круглых значений.
- Золото (XAUUSD): Установите единицу в пункты (Pips) с интервалом 10 или 50 для чистых ценовых уровней $1.00 и $5.00.
- Индексы (US30, NAS100): Установите единицу в брокерские пункты (Points) с интервалом 100 или 500 для ключевых уровней индекса.
- Криптовалюты (BTCUSD, ETHUSD): Установите единицу в ценовые единицы (PriceUnits) с интервалом 1000 или 5000 для основных психологических барьеров.
Сводка
AI summary
PipGrid Pro is a technical indicator designed to plot horizontal price levels aligned with psychological round numbers across multiple markets including Forex, Gold (XAUUSD), Indices, and Cryptocurrencies. It automatically calibrates grid spacing by reading broker-specific tick and pip values, ensuring accurate and mathematically consistent level placement on any symbol. The indicator supports toggling between pips, broker points, and price units for precise scaling.
Key functionalities include dynamic range tracking that recenters the grid as price moves, a safe object namespace that prevents interference with manual drawings or other indicators, and full visual customization options for line color, style, and thickness. PipGrid Pro operates efficiently with zero performance lag by executing calculations only on live bar boundaries.
Users can configure parameters such as interval unit and value, number of lines above and below the current price, and visual styles. Recommended settings are provided for different asset classes to highlight institutional order flow clusters and key support/resistance levels. This tool is intended for traders seeking clean, non-intrusive visualization of key price levels that reflect market psychology and institutional activity.
Key functionalities include dynamic range tracking that recenters the grid as price moves, a safe object namespace that prevents interference with manual drawings or other indicators, and full visual customization options for line color, style, and thickness. PipGrid Pro operates efficiently with zero performance lag by executing calculations only on live bar boundaries.
Users can configure parameters such as interval unit and value, number of lines above and below the current price, and visual styles. Recommended settings are provided for different asset classes to highlight institutional order flow clusters and key support/resistance levels. This tool is intended for traders seeking clean, non-intrusive visualization of key price levels that reflect market psychology and institutional activity.
Профиль индикатора
Категория индикатора
Поддержка и сопротивление
Тип вывода
Визуализация
Требования к данным
Только бары
Тиковые данные
Отзывы покупателей
0.0
Отзывы: 0
Отзывы покупателей
У этого продукта еще нет отзывов. Уже попробовали его? Поделитесь впечатлениями!
Обсуждение
Частые вопросы
Key Levels
Support & Resistance
Продукты, доступные в cTrader Store, включая торговых ботов, индикаторы и плагины, предоставляются сторонними разработчиками и доступны исключительно в информационных и технических целях. cTrader Store не является брокером и не предоставляет инвестиционные консультации, персональные рекомендации или какие-либо гарантии будущей доходности.
Больше от этого автора










![Логотип продукта "[Stellar Strategies] Market Session Ultimate"](https://cdn.ctrader.com/image/webp/61ffd537-0125-4246-9e72-42eca1791d64_28232)








Цена
С 10/12/2024
1
Продажи