
คำอธิบาย
- มันทำอะไร (คุณค่า)
- ช่วยเทรดเดอร์อย่างไร.
- อะไรที่ทำให้มันโดดเด่น.
- วิธีใช้งาน (สั้นๆ).
- เวอร์ชันที่ต้องชำระเงินจะปลดล็อกอะไร (แนะนำ)
🔸
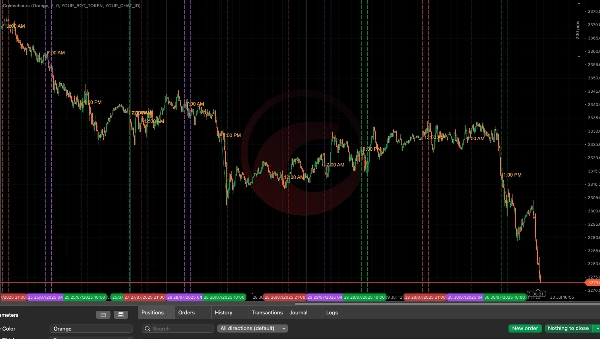
ตัวบ่งชี้ชั่วโมงทองคำของเซสชัน
(เวอร์ชันฟรี)
คำอธิบาย
ตัวบ่งชี้ Session Golden Hours ถูกออกแบบมาสำหรับเทรดเดอร์ที่จริงจังที่ต้องการมองเห็นช่วงเวลาการเทรดที่มีโอกาสสูงโดยอิงจากรูปแบบสภาพคล่องตามเซสชัน เครื่องมือนี้จะเน้นช่วงเวลาสำคัญโดยอัตโนมัติในเซสชันเอเชีย ลอนดอน และนิวยอร์ก — ซึ่งมักเรียกกันว่า “ชั่วโมงทองคำ” ของตลาด — เมื่อราคามีแนวโน้มที่จะทะลุกรอบและเผยเจตนาของสถาบัน
สิ่งที่มันทำ:
- ติดตามจุดสูง/ต่ำของเซสชันเอเชีย (00:00–08:00 UTC) เพื่อทำแผนที่โซนสภาพคล่อง
- เน้นชั่วโมงสำคัญของลอนดอนและนิวยอร์ก เช่น:
-
- ก่อนปิดลอนดอน (06:00–07:00 UTC)
- ชั่วโมงปิดลอนดอน (07:00–08:00 UTC)
- โซนสวีปบ่ายนิวยอร์ก (13:00–14:00 UTC)
- วาดเส้นนำทางภาพ บนชาร์ตของคุณเพื่อช่วยให้คุณรับรู้ช่วงเวลาที่ราคาทะลุกรอบรายวัน
สิ่งนี้ช่วยคุณอย่างไร:
- ระบุได้ง่าย โซนสวีปสภาพคล่อง ในช่วงเวลาที่เซสชันทับซ้อนกัน
- โฟกัสการตัดสินใจเทรดของคุณรอบ กรอบเวลาของเงินฉลาด — ไม่ต้องเทรดในโซนที่ไม่มีประสิทธิภาพอีกต่อไป
- รับรู้ด้วยสายตาว่าที่ไหนมักเกิดการหลอกลวงและการกลับตัว
- ใช้งานได้กับ เครื่องมือใดก็ได้ และ กรอบเวลาใดก็ได้ ที่ปฏิบัติตามรอบเซสชันทั่วโลก
คุณสมบัติหลัก:
- ปรับสีเส้น ความหนา และการขยายเวลาได้
- ติดตามเซสชันโดยอัตโนมัติ ไม่มีการวางแผนด้วยมือ
- รองรับการเทรดย้อนหลัง 15 วันล่าสุด
- ภาพชาร์ตที่สะอาดและไม่รบกวนสายตา
เหมาะสำหรับ:
- เทรดเดอร์สไตล์ ICT (สภาพคล่อง + โมเดลเวลา)
- นักสเกลปปิ้งราคาการเคลื่อนไหว
- เทรดเดอร์ที่ใช้การรวมเวลาต่างๆ
🔓 ต้องการเพิ่มเติม?
เวอร์ชัน Pro (เร็วๆ นี้) เพิ่ม:
- แจ้งเตือนการทะลุกรอบแบบเรียลไทม์ ส่งตรงไปยัง Telegram
- ตรรกะสำหรับ การหลอกลวงในเอเชีย → การกลับตัวในลอนดอน และ จุดสูง/ต่ำของลอนดอน → การกลับตัวในนิวยอร์ก
- ตัวจับเวลาคูลดาวน์อัจฉริยะเพื่อหลีกเลี่ยงการแจ้งเตือนเกินความจำเป็น
- ติดตามเต็มรูปแบบของ จุดสูง/ต่ำตามเซสชัน พร้อมการติดป้ายสัญญาณ
- แผนงานในอนาคต: แจ้งเตือน FVG, โซนสภาพคล่องภายใน และการกรองสัญญาณ
สรุป
โปรไฟล์อินดิเคเตอร์
รีวิวจากลูกค้า
4.0
รีวิว: 1
5 | 0 % | |
4 | 100 % | |
3 | 0 % | |
2 | 0 % | |
1 | 0 % |
การสนทนา
คำถามที่พบบ่อย
ผลิตภัณฑ์ที่มีให้บริการผ่าน cTrader Store รวมถึงบอทการเทรด อินดิเคเตอร์ และปลั๊กอิน มีให้บริการโดยนักพัฒนาบุคคลที่สามและมีไว้เพื่อวัตถุประสงค์ในการเข้าถึงข้อมูลและทางเทคนิคเท่านั้น cTrader Store ไม่ใช่โบรกเกอร์และไม่ได้ให้คำแนะนำการลงทุน คำแนะนำส่วนบุคคล หรือการรับประกันผลการดำเนินงานในอนาคต


ราคา
3
ติดตั้งฟรี