
AllPattern
อินดิเคเตอร์
362 ดาวน์โหลด
เวอร์ชัน 1.0, Aug 2025
Windows, Mac
5.0
รีวิว: 2
คำอธิบาย
🔍 ค้นพบรูปแบบแท่งเทียนทั้งหมด… ฟรีอย่างแน่นอน! 😀
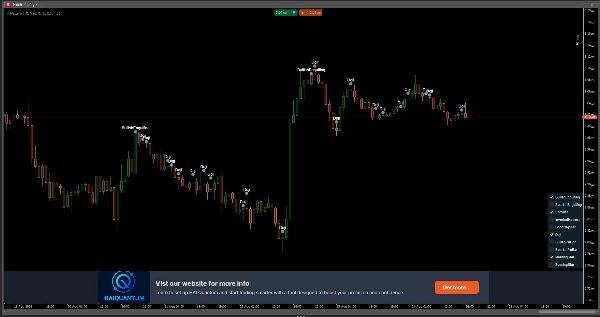
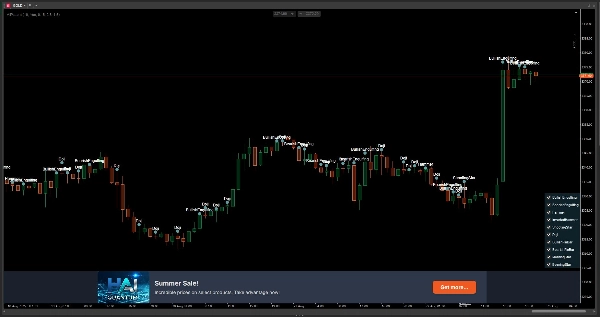
ด้วยเครื่องมือของเรา คุณสามารถมองเห็น รูปแบบแท่งเทียนหลักทั้งหมด ได้โดยตรงบนชาร์ตของคุณ ตั้งแต่ Doji ถึง Bullish Engulfing รวมถึง Hammer, Shooting Star และอื่นๆ อีกมากมาย
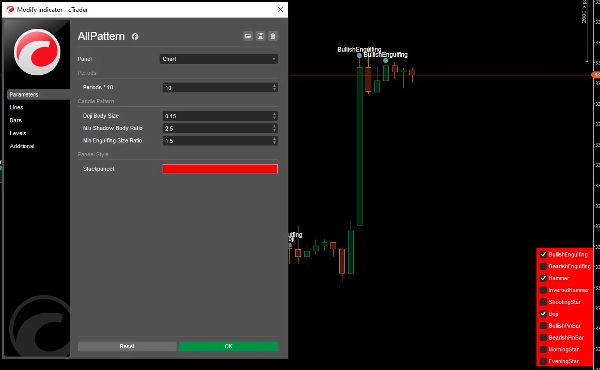
📌 มันทำงานอย่างไร? ง่ายมาก: ใช้แผงควบคุมทางขวาเพื่อ เลือกเฉพาะรูปแบบที่คุณต้องการแสดง เปิดหรือปิดเพื่อให้ตรงกับกลยุทธ์การเทรดของคุณ
💸 ส่วนที่ดีที่สุด? มันฟรีอย่าง สมบูรณ์! ไม่มีการสมัครสมาชิก ไม่มีข้อจำกัด—แค่การวิเคราะห์ด้วยภาพที่บริสุทธิ์
สรุป
โปรไฟล์อินดิเคเตอร์
รีวิวจากลูกค้า
5.0
รีวิว: 2
5 | 100 % | |
4 | 0 % | |
3 | 0 % | |
2 | 0 % | |
1 | 0 % |
รีวิวจากลูกค้า
October 8, 2025
Chart artist’s dream! 🧠 Spots triangles, wedges, flags — all in one go. Saves tons of time on manual pattern drawing. Great helper, but always double-check those breakouts!
การสนทนา
คำถามที่พบบ่อย
BTCUSD
Forex
Signal
Breakout
Indices
EURUSD
Commodities
GBPUSD
NZDUSD
Martingale
Prop
Scalping
Crypto
Grid
Stocks
AI
XAUUSD
NAS100
USDJPY
ผลิตภัณฑ์ที่มีให้บริการผ่าน cTrader Store รวมถึงบอทการเทรด อินดิเคเตอร์ และปลั๊กอิน มีให้บริการโดยนักพัฒนาบุคคลที่สามและมีไว้เพื่อวัตถุประสงค์ในการเข้าถึงข้อมูลและทางเทคนิคเท่านั้น cTrader Store ไม่ใช่โบรกเกอร์และไม่ได้ให้คำแนะนำการลงทุน คำแนะนำส่วนบุคคล หรือการรับประกันผลการดำเนินงานในอนาคต


ราคา
147
การขาย
11.17K
ติดตั้งฟรี