
説明
PMax(プロフィットマキシマイザー)は、2020年初頭にKivancOzbilgicによって開発された全く新しいインジケーターです。
これは2つのトレーリングストップロスインジケーターの組み合わせです;
一つはAnıl ÖzekşiのMOST(ムービングストップロス)インジケーターで、もう一つはよく知られたATRベースのSuperTrendです。
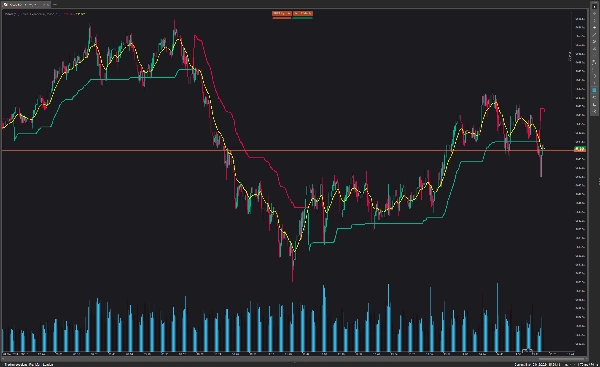
MOSTとSuperTrendの両方のインジケーターはトレンドフォローシステムに非常に優れていますが、逆に他の多くのインジケーターと同様に横ばいの市場状況ではパフォーマンスが良くありません。
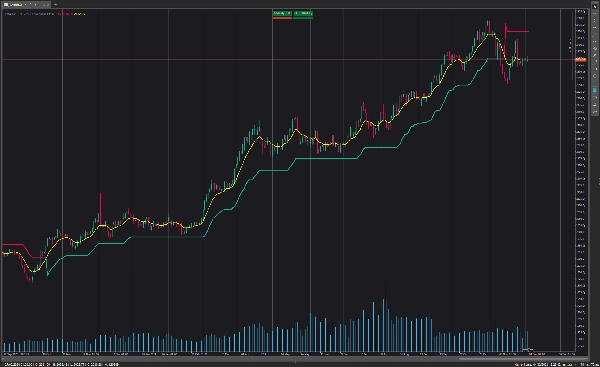
プロフィットマキシマイザー - PMaxはこの問題を解決しようとします。 PMaxはMOST(移動平均トレンドチェンジャー)とSuperTrend(ATR価格検出)の強力な側面を一つのインジケーターに組み合わせています。
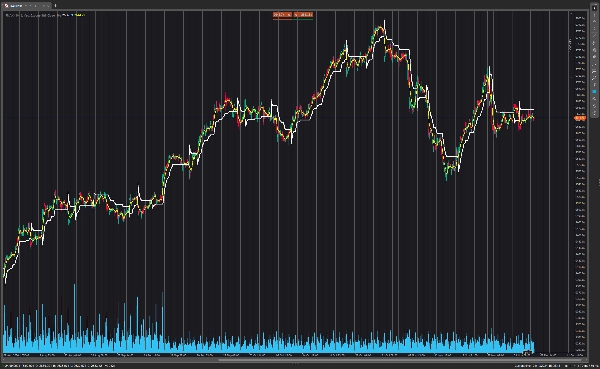
PMaxのバックテストと最適化の結果は、その先祖であるMOSTとSuperTrendと比較してはるかに優れています。横ばい相場での誤信号の数を減らし、より信頼性の高い取引シグナルを提供します。
PMaxはトレンドを簡単に判断でき、あらゆるタイプの市場や銘柄で使用できます。再描画はしません。
概要
AIによる概要
PMax (Profit Maximizer) is a technical indicator developed in 2020 that combines two trailing stop loss indicators: Anıl Özekşi's MOST (Moving Stop Loss) and the ATR-based SuperTrend. Both MOST and SuperTrend are effective for trend-following strategies but tend to generate false signals in sideways markets. PMax addresses this limitation by integrating the strengths of MOST’s moving average trend detection and SuperTrend’s ATR price volatility measurement into a single indicator.
This combination enhances trend identification and reduces false signals during non-trending market phases. Backtesting and optimization show that PMax outperforms its component indicators in reliability and signal accuracy. It is designed for use across various markets and instruments and does not repaint, providing consistent signals for traders.
This combination enhances trend identification and reduces false signals during non-trending market phases. Backtesting and optimization show that PMax outperforms its component indicators in reliability and signal accuracy. It is designed for use across various markets and instruments and does not repaint, providing consistent signals for traders.
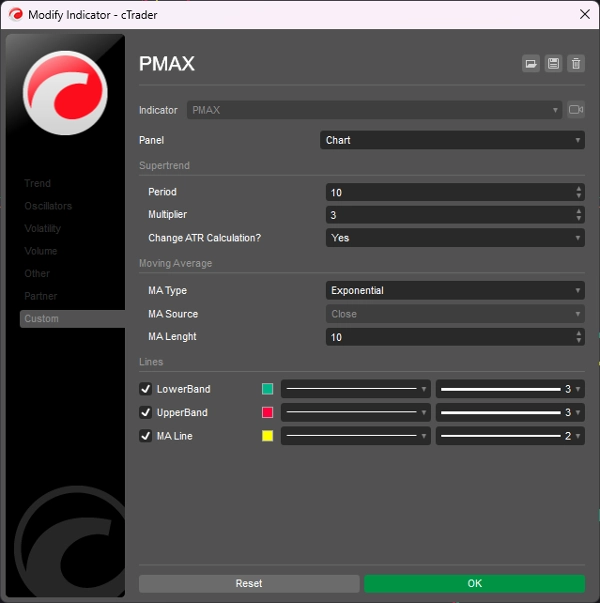
インジケーターのプロフィール
カスタマーレビュー
5.0
レビュー: 6
5 | 100 % | |
4 | 0 % | |
3 | 0 % | |
2 | 0 % | |
1 | 0 % |
カスタマーレビュー
August 12, 2025
Fantastic Job at translating. Could you tell us how you did the ATR normalization in ctrader, I can't figure it out and I want to built an cbot with this opttion ty!
July 9, 2025
Pros: Combines Moving Average and ATR for dynamic trend detection. Provides clear buy/sell signals. Easy setup, stable performance. Cons: No alerts on signal change. No tooltips or saved templates. Requires additional confirmation for reliable entries.
June 16, 2025
ディスカッション
よくあるご質問
Supertrend
ATR
cTrader Storeで入手可能な取引ボット、インジケーター、プラグインなどの商品は、第三者の開発者が提供するものであり、情報と技術の取得のみを目的としてご利用いただけます。cTrader Storeはブローカーではなく、投資助言や個人的な推奨を行うことも、将来のパフォーマンスを保証することもありません。


価格
2
販売
6.9K
無料インストール