
market session
Wskaźnik
869 pobrania
Wersja 1.0, Aug 2025
Windows, Mac
4.6
Opinie: 6
Opis
📊 Wskaźnik Sesji Rynkowych
Profesjonalny wskaźnik sesji handlowych do analizy aktywności rynku
📝 Opis
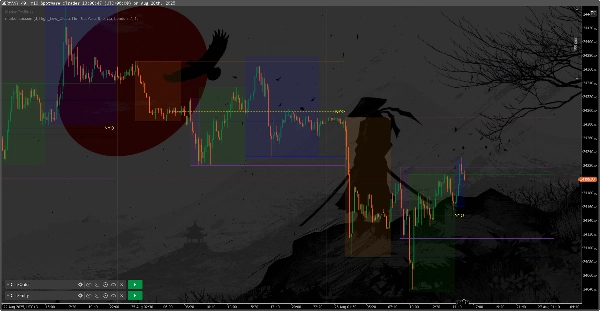
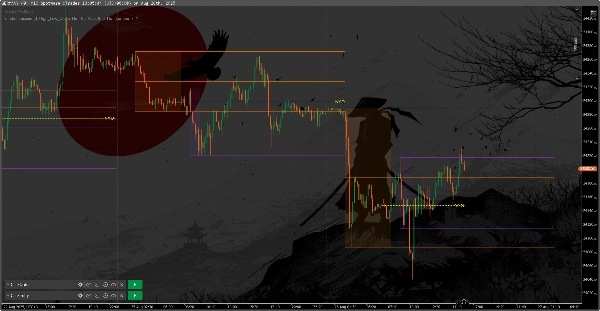
Market Sessions to potężny i elastyczny wskaźnik, który wizualizuje główne sesje handlowe na Twoim wykresie. Jest idealny dla traderów forex, a także do handlu innymi instrumentami finansowymi, w tym kryptowalutami.
✨ Kluczowe funkcje
🌏 Pełne wsparcie sesji handlowych
- Sesja azjatycka 🇯🇵 (Tokio)
- Sesja londyńska 🇬🇧 (Londyn)
- Sesja nowojorska 🇺🇸 (Nowy Jork)
- Sesja frankfurcka 🇩🇪 (Frankfurt)
🎨 Elastyczna wizualizacja
- 🎯 Kolorowe prostokąty dla każdej sesji
- 📏 Poziome linie High/Low/Mid z rozszerzeniami
- 🏷️ Możliwość dostosowania nazw sesji
- 🔧 Regulowana przezroczystość i grubość linii
⚙️ Zaawansowane ustawienia
- 🕒 Możliwość dostosowania godzin dla każdej sesji
- 📅 Liczba dni do wyświetlenia (domyślnie 3)
- 🔄 Tryb rozszerzenia linii (Brak/High_Low/High_Low_Close)
🟡 Linia NYO (New York Open)
- ⏰ Wyświetlanie linii otwarcia Nowego Jorku
- 🎨 Możliwość dostosowania koloru, stylu i grubości linii
- 🔢 Regulowany czas NYO (domyślnie 04:00 UTC)
Podsumowanie
Podsumowanie AI
The Market Session indicator visually delineates major global trading sessions on financial charts, supporting the Asian (Tokyo), London, New York, and Frankfurt sessions. Designed for forex and other markets including cryptocurrencies, it displays each session as colored rectangles with customizable session names. The indicator features horizontal lines marking session high, low, and mid levels, which can be extended according to user settings. Users can adjust session times, transparency, line thickness, and the number of days displayed (default is three). Additionally, it includes a customizable New York Open (NYO) line with adjustable time, color, style, and thickness. This tool aids traders in analyzing market activity by clearly identifying key trading periods and price levels associated with each session.
Profil wskaźnika
Opinie klientów
4.6
Opinie: 6
5 | 83 % | |
4 | 0 % | |
3 | 17 % | |
2 | 0 % | |
1 | 0 % |
Opinie klientów
June 27, 2026
February 27, 2026
September 1, 2025
Very convenient and easy to use. Nothing extra, only the most necessary in the settings and on the chart. I recommend this indicator.
August 26, 2025
good indicator but its not clear though a little difficult to understand and the newyork open line seems tobe no where near the newyork session
Dyskusja
Częste pytania
Produkty dostępne za pośrednictwem cTrader Store, w tym boty handlowe, wskaźniki i wtyczki, dostarczane są przez deweloperów zewnętrznych i udostępniane wyłącznie w celach informacyjnych oraz w celu zapewnienia dostępu technicznego. cTrader Store nie jest brokerem i nie zapewnia doradztwa inwestycyjnego, nie udziela spersonalizowanych rekomendacji ani nie gwarantuje przyszłych wyników.


Cena
Od 16/07/2025
869
Bezpłatne instalacje