Açıklama
🧠 OBScope™ – Yüksek Olasılıklı İşlemler için Hassas Emir Bloğu Haritalaması
OBScope™ ile piyasanın gizli yapısını açığa çıkarın; swing yüksekleri, swing düşükleri ve gelişmiş fiyat hareketi analizine dayalı yüksek olasılıklı emir bloğu bölgelerini tespit etmek ve görselleştirmek için tasarlanmış son teknoloji bir gösterge.
İster deneyimli bir tüccar olun ister avantajınızı geliştirin, OBScope™ size akıllı paranın iz bıraktığı kurumsal ayak izlerinin kristal netliğinde bir görünümünü sunar.
🔍 Temel Özellikler:
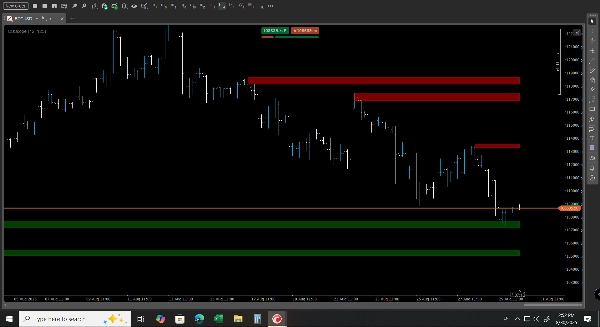
• Dinamik Emir Bloğu Tespiti
Swing yapısı ve hacim bilgisine dayalı mantık kullanarak fiyatın geçmişte tersine döndüğü veya konsolide olduğu bölgeleri otomatik olarak tanımlar ve boyar.
• Yüksek Olasılıklı İşlem Bölgeleri
Gürültüyü filtreler ve yalnızca kanıtlanmış tepki geçmişi ve optimal risk-ödül düzenlerine sahip en istatistiksel olarak anlamlı emir bloklarını vurgular.
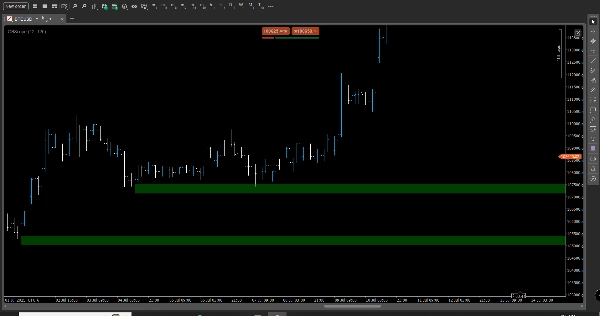
• Swing Tabanlı Mantık
Anlamlı piyasa yapısında bölgeleri sabitlemek için swing yüksek/düşük analizini entegre eder, zamanlama ve yönsel önyargıyı iyileştirir.
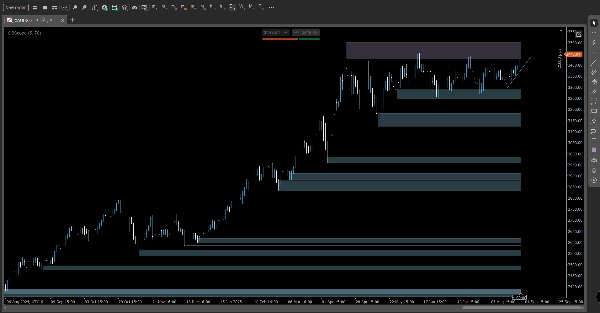
• Performans Odaklı Tasarım
Gerçek piyasa doğrulaması ile test edilmiş algoritmalar üzerine inşa edilmiştir, OBScope™ birden fazla varlık sınıfı ve zaman diliminde tutarlı sonuçlar göstermiştir.
• Özelleştirilebilir Görselleştirme
Ayarlanabilir bölge opaklığı, renk kodlaması ile temiz, modüler kullanıcı arayüzü—discretionary ve algoritmik iş akışları için özel olarak tasarlanmıştır.
📈 Tüccarların OBScope™'u Sevme Nedenleri:
• Bölge tanımlamada tahmin yürütmeyi azaltır
• Diğer stratejilerle (örneğin likidite süpürmeleri, dengesizlik doldurmaları) uyumu artırır
• Hem kırılma hem de dönüş düzenlerini destekler
• Skalping, swing trading ve prop firma zorlukları için idealdir
Özet
Müşteri değerlendirmeleri
5 | 100 % | |
4 | 0 % | |
3 | 0 % | |
2 | 0 % | |
1 | 0 % |


!["[Stellar Strategies] MARSI Signal Plotter" logosu](https://cdn.ctrader.com/image/webp/7b2b8da6-8f8e-4646-8d4a-4710c516c01e_25567)
