
Beschreibung
Trend Pullback Profiler
Trend Pullback Profiler ist ein cTrader-Indikator, der entwickelt wurde, um zu analysieren, wie ein Trend atmet, indem die Tiefe und Häufigkeit von Rücksetzern gemessen wird – jetzt auch in Fibonacci-Retracement %.
Mit einem EMA-basierten Trendfilter:
- erkennt er, wann ein klarer Aufwärtstrend oder Abwärtstrend vorliegt;
- identifiziert jeden bestätigten Rücksetzer innerhalb dieses Trends;
- misst die Rückzugs-Tiefe in Pips;
- berechnet den Fibonacci-Retracement-Prozentsatz relativ zum letzten Impulsabschnitt;
- verfolgt live:
-
- wie viele Rücksetzer im aktuellen Trend aufgetreten sind,
- die letzte Rückzugs-Tiefe,
- die durchschnittliche Rückzugs-Tiefe,
- den letzten Fibonacci-Retracement-Prozentsatz.
Im Chart:
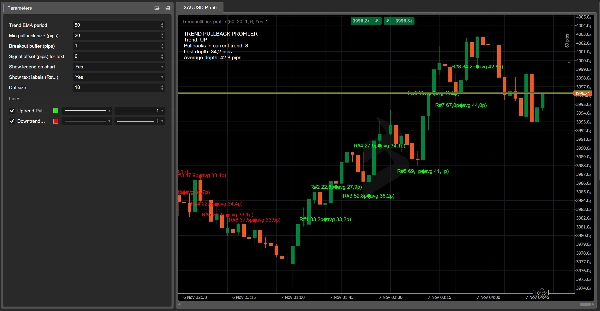
- zeichnet er einen großen grünen Punkt am Tief des Rücksetzers in einem Aufwärtstrend,
- einen großen roten Punkt am Hoch des Rücksetzers in einem Abwärtstrend,
- druckt optional ein kompaktes Label wie:
22.5 p / 38.2%.
In der oberen linken Ecke zeigt eine dynamische Legende:
- die aktuelle Trendrichtung (AUF / AB / KEIN);
- Anzahl der Rücksetzer im aktuellen Trend;
- letzte Rückzugs-Tiefe (in Pips);
- durchschnittliche Rückzugs-Tiefe (in Pips);
- letzter Fibonacci-Retracement-Prozentsatz.
Wichtige Parameter
- Trend EMA-Periode
EMA-Periode zur Definition der Trendrichtung. - Minimale Rückzugsgröße (Pips)
Mindesttiefe des Rücksetzers (in Pips), um als gültiges Retracement zu zählen. - Breakout-Puffer (Pips)
Zusätzliche Distanz, die der Preis über das vorherige Trendextrem hinaus bewegen muss, um ein neues Bein zu bestätigen und den Rücksetzer zu schließen. - Signalversatz (Pips) für Text
Vertikaler Versatz für Textlabels relativ zum Hoch/Tief des Rücksetzers. - Legende im Chart anzeigen
Schaltet die Legende im Chart mit Trend-, letzten und durchschnittlichen Metriken ein oder aus. - Textlabels neben Punkten anzeigen
Wenn aktiviert, wird ein kleines Label neben dem Punkt mit der Rückzugs-Tiefe (und optional Fibonacci %) gedruckt. - Fibonacci % in Labels anzeigen
Wenn aktiviert, werden sowohl Pips als auch Fibonacci % im Label angezeigt (XX.Xp / YY.Y%). - Punktgröße
Steuert, wie groß die Punkte im Chart erscheinen, sodass Rücksetzer auch in niedrigeren Zeitrahmen leicht zu erkennen sind.
Praktische Anwendungsfälle
- Visuelle Profilerstellung, wie tief Rücksetzer bei einem bestimmten Symbol/Zeitfenster üblicherweise sind.
- Planung von Limit-Einstiegen rund um typische Retracement-Zonen statt zufälliger Levels.
- Erkennung ungewöhnlich tiefer Rücksetzer (z. B. über 61,8 % oder 78,6 %), die auf Trenderschöpfung oder eine mögliche Umkehr hinweisen können.
- Hinzufügen objektiver, numerischer Rückzugs- und Fibonacci-Informationen zu Ihrem Trend-Trading-Playbook.
Wie das Fibonacci-Retracement im Trend Pullback Profiler berechnet wird
Der Trend Pullback Profiler berechnet den Fibonacci-Retracement-Prozentsatz basierend auf dem letzten Impulsabschnitt des Trends, nicht auf willkürlichen Hochs und Tiefs.
In einem Aufwärtstrend
- Verfolgt der Indikator einen Impulsabschnitt von:
-
- Trend-Basispreis = letztes signifikantes Tief (Ende des vorherigen Rücksetzers)
- Trend-Extrem = letztes Swing-Hoch des Trends
- Wenn ein Rücksetzer entsteht, misst der Indikator:
-
- Tiefe des Rücksetzers (Preis):
depthPrice = trendHigh – pullbackLow - Größe des Impulsabschnitts:
legSize = trendHigh – trendBasePrice
- Tiefe des Rücksetzers (Preis):
- Der Fibonacci-Retracement-Prozentsatz ist:
Fib% = (depthPrice / legSize) * 100
Wenn der Preis also etwa 38,2 %–50 % des letzten Impulsabschnitts zurückfällt, bevor er weiter steigt, sehen Sie Werte nahe 38,2%, 50%, 61,8% usw.
In einem Abwärtstrend
- Verläuft der Impulsabschnitt von:
-
- Trend-Basispreis = letztes signifikantes Hoch (Ende des vorherigen Rücksetzers)
- Trend-Extrem = letztes Swing-Tief des Trends
- Der Rücksetzer geht nach oben gegen den Trend, und der Indikator misst:
-
- Tiefe des Rücksetzers (Preis):
depthPrice = pullbackHigh – trendLow - Größe des Impulsabschnitts:
legSize = trendBasePrice – trendLow
- Tiefe des Rücksetzers (Preis):
- Gleiche Formel:
Fib% = (depthPrice / legSize) * 100
Auf diese Weise repräsentiert jeder Punkt, den Sie im Chart sehen, einen Rücksetzer innerhalb eines klaren Impulses des aktuellen Trends, ausgedrückt sowohl in Pips als auch in Fibonacci %, sodass Sie schnell beurteilen können, ob ein Retracement flach, typisch oder ungewöhnlich tief ist.
Zusammenfassung
Key features include:
- Detection of trend direction and pullbacks.
- Measurement of pullback depth and Fibonacci retracement percentage.
- Live tracking of the number of pullbacks, last pullback depth, average pullback depth, and last Fibonacci retracement percentage.
- Visual chart elements such as large green dots at pullback lows in uptrends and large red dots at pullback highs in downtrends.
- Optional compact labels displaying pullback depth and Fibonacci percentage.
- A dynamic legend showing current trend direction, pullback counts, and metrics.
The Fibonacci retracement is calculated based on the last impulse leg, defined by the last significant trend base and extreme prices, providing objective numeric data to assess whether retracements are shallow, typical, or unusually deep. The indicator supports various markets including Forex, indices, commodities, cryptocurrencies, and stocks. It offers configurable parameters such as EMA period, minimum pullback size, breakout buffer, and display options for labels and legend.
Kundenbewertungen
5 | 50 % | |
4 | 50 % | |
3 | 0 % | |
2 | 0 % | |
1 | 0 % |


