

คำอธิบาย
SUPER TREND OSCILLATOR TRIAL DAY15
"โปรดทราบ," ในเวอร์ชันที่ชำระเงินมีเวอร์ชันทดลองใช้งานฟรี 15 วันด้วย" คลิกที่ผลิตภัณฑ์ที่ชำระเงินและคุณจะพบเวอร์ชันฟรี-
Simplified SuperTrend Oscillator - คำอธิบายครบถ้วน
ภาพรวม
ตัว Simplified SuperTrend Oscillator เป็นตัวบ่งชี้ทางเทคนิคขั้นสูงสำหรับ cTrader ที่เปลี่ยน SuperTrend แบบคลาสสิกให้เป็นออสซิลเลเตอร์แบบภาพ ช่วยให้ระบุทิศทางแนวโน้ม ความแข็งแกร่ง และความน่าเชื่อถือได้ง่ายขึ้น
ส่วนประกอบหลัก
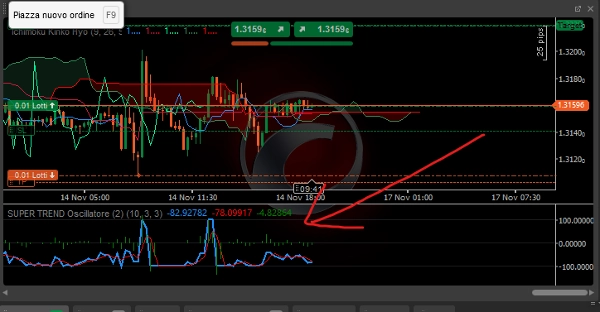
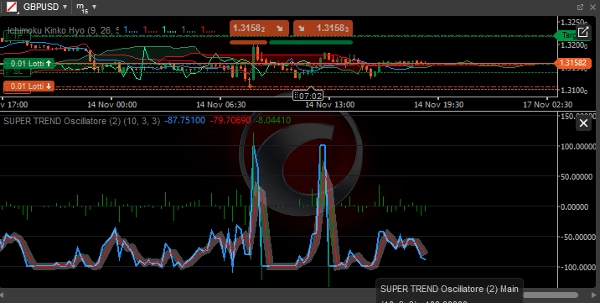
1. เส้นหลัก (สีน้ำเงิน)
- ฟังก์ชัน: แสดงระยะห่างที่ปรับมาตรฐานระหว่างราคาและเส้น SuperTrend
- การคำนวณ:
((Price - SuperTrend) / (ATR × Multiplier)) × 100 - การตีความ:
-
- > 0: แนวโน้มขาขึ้น (ราคาสูงกว่า SuperTrend)
- < 0: แนวโน้มขาลง (ราคาต่ำกว่า SuperTrend)
- ช่วง: จาก -100 ถึง +100
2. เส้นสัญญาณ (สีแดง)
- ฟังก์ชัน: ค่าเฉลี่ยเคลื่อนที่ง่ายของเส้นหลัก
- ช่วงเวลา: ปรับแต่งได้ (ค่าเริ่มต้น 3 ช่วงเวลา)
- การใช้งาน: กรองเสียงรบกวนของตลาดและยืนยันสัญญาณ
3. ฮิสโตแกรม (สีเทา)
- ฟังก์ชัน: ความแตกต่างระหว่างเส้นหลักและเส้นสัญญาณ
- การตีความ:
-
- บวก: โมเมนตัมขาขึ้นเร่งตัว
- ลบ: โมเมนตัมขาลงเร่งตัว
- การตัดผ่านศูนย์: การกลับตัวของโมเมนตัมที่เป็นไปได้
พารามิเตอร์ที่ปรับแต่งได้
พารามิเตอร์ SuperTrend:
- ช่วงเวลา ATR: ช่วงเวลาสำหรับการคำนวณ Average True Range (ค่าเริ่มต้น: 10)
- ตัวคูณ: ตัวคูณสำหรับแถบ SuperTrend (ค่าเริ่มต้น: 3.0)
พารามิเตอร์ออสซิลเลเตอร์:
- ช่วงเวลาสัญญาณ: ช่วงเวลาสำหรับเส้นสัญญาณ (ค่าเริ่มต้น: 3)
การตีความสัญญาณ
เงื่อนไขแนวโน้ม:
- แนวโน้มขาขึ้นที่แข็งแกร่ง:
-
- เส้นหลัก > +50
- เส้นหลัก > เส้นสัญญาณ
- ฮิสโตแกรมบวก
- แนวโน้มขาลงที่แข็งแกร่ง:
-
- เส้นหลัก < -50
- เส้นหลัก < เส้นสัญญาณ
- ฮิสโตแกรมลบ
- ตลาดที่เคลื่อนไหวในช่วงแคบ:
-
- เส้นหลักอยู่ระหว่าง -30 ถึง +30
- เส้นตัดกันบ่อยครั้ง
สัญญาณการซื้อขาย:
การเข้าซื้อระยะยาว:
- เส้นหลักตัดขึ้นเหนือ 0
- ฮิสโตแกรมกลายเป็นบวก
- เส้นสัญญาณยืนยันแนวโน้มขาขึ้น
- เส้นหลักสูงกว่า +20 เพื่อโมเมนตัม
การเข้าซื้อระยะสั้น:
- เส้นหลักตัดลงต่ำกว่า 0
- ฮิสโตแกรมกลายเป็นลบ
- เส้นสัญญาณยืนยันแนวโน้มขาลง
- เส้นหลักต่ำกว่า -20 เพื่อโมเมนตัม
ออก/ทำกำไร:
- ระยะยาว: เส้นหลัก > +80 (ซื้อมากเกินไป) หรือ ตัดลงต่ำกว่าเส้นสัญญาณ
- ระยะสั้น: เส้นหลัก < -80 (ขายมากเกินไป) หรือ ตัดขึ้นเหนือเส้นสัญญาณ
ข้อดีของเวอร์ชันที่เรียบง่าย
1. ประสิทธิภาพที่ปรับปรุง
- การคำนวณที่มีประสิทธิภาพมากขึ้น
- การใช้ทรัพยากรต่ำลง
- ตอบสนองต่อการเปลี่ยนแปลงราคาที่รวดเร็วขึ้น
2. ใช้งานง่าย
- ลดพารามิเตอร์ที่จำเป็น
- สัญญาณภาพทันที
- ตีความง่ายแม้สำหรับผู้เริ่มต้น
3. ความน่าเชื่อถือ
- มีความไวต่อเสียงรบกวนน้อยลง
- สัญญาณที่ชัดเจนและกำหนดได้มากขึ้น
- ลดสัญญาณเท็จเมื่อเทียบกับ SuperTrend แบบคลาสสิก
กลยุทธ์การใช้งาน
กลยุทธ์ตามแนวโน้ม:
- การเข้า: เส้นหลัก > 0 สำหรับระยะยาว, เส้นหลัก < 0 สำหรับระยะสั้น
- ตัวกรอง: ฮิสโตแกรมมีเครื่องหมายเดียวกับเส้นหลัก
- ออก: การกลับเครื่องหมายหรือตัวเลขสุดขีดที่ถึง
กลยุทธ์โมเมนตัม:
- การเข้า: เส้นหลัก > +30 (ระยะยาว) หรือ เส้นหลัก < -30 (ระยะสั้น)
- การยืนยัน: ฮิสโตแกรมเร่งความเร็ว
- ออก: โมเมนตัมชะลอตัว (ฮิสโตแกรมลดลง)
กลยุทธ์การกลับตัวเฉลี่ย:
- การเข้า: เส้นหลัก > +80 (ระยะสั้น) หรือ เส้นหลัก < -80 (ระยะยาว)
- การยืนยัน: ฮิสโตแกรมกลับตัว
- ออก: กลับสู่โซนเป็นกลาง
สภาพตลาดที่เหมาะสมที่สุด
ตลาดที่มีแนวโน้ม:
- ประสิทธิภาพสูง
- สัญญาณยาวนาน
- การแกว่งตัวน้อยลง
ตลาดที่เคลื่อนไหวในช่วงแคบ:
- ลดขนาดล็อต
- ขยายกรอบเวลา
- ใช้เป็นตัวกรองโมเมนตัม
แนวทางปฏิบัติที่ดีที่สุด
กรอบเวลาที่แนะนำ:
- อินทราเดย์: M15 - H1
- สวิงเทรดดิ้ง: H4 - D1
- โพซิชันเทรดดิ้ง: W1 - MN
การจัดการความเสี่ยง:
- หยุดขาดทุน: 1.5-2 × ATR
- ทำกำไร: 2-3 × ความเสี่ยง
- ขนาดตำแหน่ง: 1-2% ต่อการเทรด
การยืนยันเพิ่มเติม:
- การจัดตำแหน่งกรอบเวลาหลายระดับ
- การยืนยันปริมาณ
- ระดับแนวรับ/แนวต้านสำคัญ
ข้อจำกัด
ข้อควรพิจารณา:
- ความล่าช้าที่มีอยู่ (ตัวบ่งชี้ตามแนวโน้ม)
- ประสิทธิภาพลดลงในตลาดที่เคลื่อนไหวในช่วงแคบ
- ต้องการการยืนยันในช่วงความผันผวนต่ำ
คำแนะนำ:
- ผสมผสานกับการวิเคราะห์ราคาการเคลื่อนไหว
- ใช้เป็นตัวกรอง ไม่ใช่ระบบเดี่ยว
- ทดสอบเดโมก่อนใช้งานจริง
ออสซิลเลเตอร์นี้เป็นเครื่องมือที่ทรงพลังสำหรับการระบุแนวโน้มที่แข็งแกร่งและกรองสัญญาณเท็จ ในขณะที่ยังคงความเรียบง่ายในการใช้งาน เหมาะสำหรับทั้งผู้เริ่มต้นและเทรดเดอร์ที่มีประสบการณ์
สรุป
รีวิวจากลูกค้า
5 | 0 % | |
4 | 100 % | |
3 | 0 % | |
2 | 0 % | |
1 | 0 % |


!["[CB] Pivot Points Pro" โลโก้](https://cdn.ctrader.com/image/webp/43463c82-67b0-4f10-a4ba-901bba091d81_32594)


