Açıklama
🚀 KURUMSAL VWAP - Profesyonel Ticaret Göstergesi
Gerçek Hacim Ağırlıklı Ortalama Fiyat ile Bankalar ve Hedge Fonlar Gibi Ticaret Yapın
KURUMSAL VWAP, kurumsal traderların, piyasa yapıcıların ve profesyonel masaların adil değeri belirlemek ve piyasayı hareket ettirmeden büyük emirleri gerçekleştirmek için kullandığı tam araçtır. Artık piyasayı kurumsal gözlerle görmek isteyen perakende traderlar için de mevcut.
💎 VWAP'ın Kurumsal Ticaret İçin En Önemli Gösterge Olmasının Nedeni
VWAP (Hacim Ağırlıklı Ortalama Fiyat) sadece başka bir hareketli ortalama değildir - kurumların yürütme kalitesini ölçmek için kullandığı referans fiyatıdır. Bir banka 50 milyon dolarlık bir emir gerçekleştirdiğinde, VWAP'ın üzerinde mi yoksa altında mı satın aldığına göre değerlendirilir. Bu kurumsal standarttır.
✨ Bu VWAP'ı Farklı Kılan Nedir:
🎯 Oturum Bazlı Sıfırlama
- Piyasa açılışında otomatik sıfırlanır (özelleştirilebilir saatler)
- Önceki günlerden taşınmayan gerçek intraday VWAP hesaplar
- Sadece BUGÜN'ün oturumunun "adil fiyatını" gösterir
📊 Üçlü Standart Sapma Bantları
- 3 seviyede istatistiksel sapma bantları (±1σ, ±2σ, ±3σ)
- Fiyatın istatistiksel olarak aşırı alım veya aşırı satımda olduğunu belirler
- Fiyat hareketinin %68'i ±1σ içinde, %95'i ±2σ içinde, %99.7'si ±3σ içinde kalır
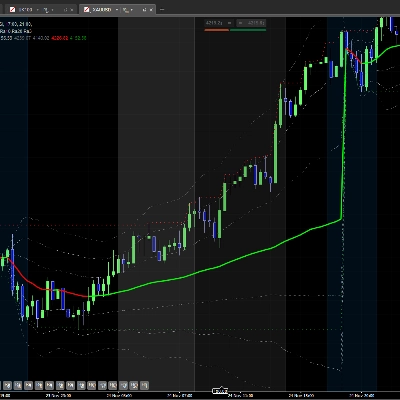
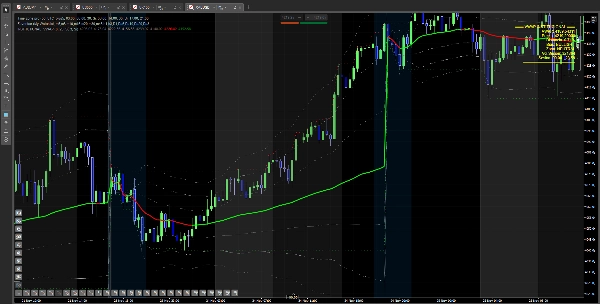
🎨 Dinamik Renk Kodlu VWAP Çizgisi
- VWAP yükselirken YEŞİL (kurumsal alım baskısı)
- VWAP düşerken KIRMIZI (kurumsal satış baskısı)
- Kurumsal duyarlılığın anlık görsel onayı
📈 Günlük Yüksek/Düşük İşaretleyiciler
- Oturum yüksek ve düşüğünü otomatik olarak takip eder ve gösterir
- Stopların biriktiği ana seviyeler (likidite bölgeleri)
- Kurumsal traderlar dönüşler için bu seviyeleri hedefler
🔍 Gerçek Zamanlı Kurumsal Bölgeler
- "EJECUCIÓN ÓPTIMA" - VWAP yakınında fiyat (en iyi giriş bölgesi)
- "SOBREEXTENDIDO" - VWAP'tan uzak fiyat (dönüş olası)
- "NEUTRAL" - Normal fiyat hareketi
🎯 Kurumsal Traderlar VWAP'ı Nasıl Kullanır
Strateji 1: Kurumsal Akışla Ticaret
VWAP YEŞİL (Yükseliyor) Olduğunda: Kurumlar birikim yapıyor (alıyor). Bu demektir ki:
- Uzun pozisyon eğilimi - sadece alım fırsatlarına bakın
- VWAP çizgisine geri çekilmeleri bekleyin
- Fiyat VWAP'a dokunduğunda ve sıçradığında girin
- Stop loss: VWAP'ın altında veya -1σ bandının altında
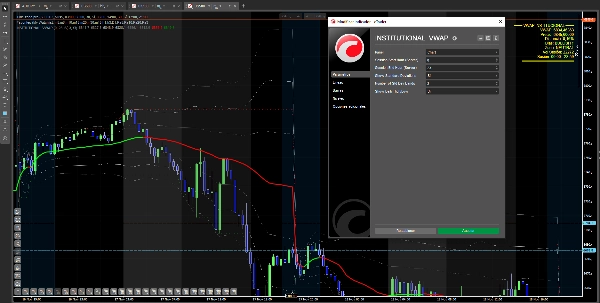
VWAP KIRMIZI (Düşüyor) Olduğunda: Kurumlar dağıtım yapıyor (satıyor). Bu demektir ki:
- Kısa pozisyon eğilimi - sadece satış fırsatlarına bakın
- VWAP çizgisine rallileri bekleyin
- Fiyat VWAP'a dokunduğunda ve reddettiğinde girin
- Stop loss: VWAP'ın üzerinde veya +1σ bandının üzerinde
Neden İşe Yarıyor: Büyük parayla birlikte ticaret yapıyorsunuz, onlara karşı değil. Kurumlar alım yaparken, en az direnç yolu YUKARIdır.
Strateji 2: Aşırı Bantlardan Ortalama Dönüş
Kurulum: Fiyat ±2σ veya ±3σ bandına ulaşır (adil değerden aşırı sapmış)
İstatistiksel Gerçek:
- Fiyatın sadece %5'i ±2σ dışına çıkar
- Fiyatın sadece %0.3'ü ±3σ dışına çıkar
- VWAP'a ortalama dönüş yüksek olasılıklıdır
Ticaretiniz:
- Fiyat +3σ bandında = VWAP'a doğru yüksek olasılıklı KISA pozisyon
- Fiyat -3σ bandında = VWAP'a doğru yüksek olasılıklı UZUN pozisyon
- Hedef: VWAP çizgisi
- Stop: Aşırı bandın ötesi
Neden İşe Yarıyor: İstatistikleri kullanıyorsunuz. Fiyat 3 standart sapma uzaklığındayken, olasılık ortalamaya (VWAP) dönüşü kuvvetle destekler.
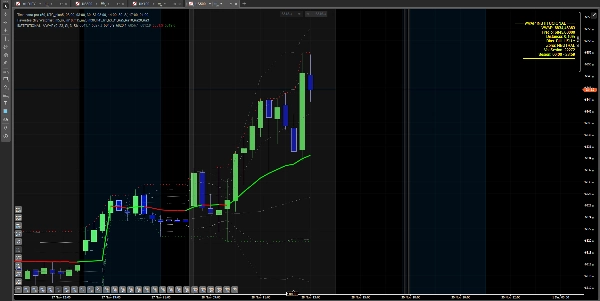
Strateji 3: Kurumsal Geri Çekilme Girişi
Mükemmel Kurulum:
- VWAP YEŞİL (kurumsal alım)
- Fiyat VWAP'tan güçlü bir hareket yapar (+1σ veya +2σ'ye ulaşır)
- Fiyat VWAP'a doğru geri çekilir
- Fiyat VWAP çizgisine dokunur ama VWAP YEŞİL kalır
- UZUN GİRİŞ - Kurumlar hala dipten alıyor
Neden Bu Altın Değerinde: Onaylanmış bir yükseliş trendinde kurumsal "adil fiyat"dan alıyorsunuz. Hedge fonların pozisyonları biriktirme şekli budur - emri parçalara böler ve VWAP'a her geri çekilmeyi satın alırlar.
Strateji 4: Tuzaktan Kaçının - Ne Zaman Ticaret Yapılmamalı
Almayın:
- Fiyat +2σ bandının üzerinde (aşırı genişlemiş, geri çekilme olası)
- VWAP KIRMIZI ama fiyat alt bantlardan sıçrıyor (ölü kedi sıçraması)
- Fiyat VWAP'ı tekrar tekrar geçiyor (dalgalı, net kurumsal yön yok)
Satmayın:
- Fiyat -2σ bandının altında (aşırı satım, sıçrama olası)
- VWAP YEŞİL ama fiyat üst bantlardan reddediyor (sadece kar realizasyonu)
- Güçlü bir trenddesiniz - trend karşıtı ticaret yapmayın
🔥 KURUMSAL VWAP'ı Üstün Kılan Nedir
Standart VWAP göstergeleri piyasa açılışından hesaplar, düzgün sıfırlanmaz, sadece temel çizgiyi gösterir, sapma bantları yoktur, bölgeler hakkında bağlam sağlamaz ve görsel eğilim göstergesi vermez.
KURUMSAL VWAP gerçek hacim ağırlıklı ortalamayı doğru oturum sıfırlamasıyla hesaplar, özelleştirilebilir oturum saatleri içerir, 3 seviyede standart sapma bantları gösterir, gerçek zamanlı bölge analizi sağlar (optimal/aşırı genişlemiş), renk kodlu eğilim göstergesi (yeşil/kırmızı) sunar ve günlük yüksek/düşük referans seviyelerini gösterir.
Bu, temel bir gösterge ile profesyonel bir ticaret aracı arasındaki farktır.
💰 Gerçek Ticaret Senaryoları
Senaryo 1: Kurumsal Birikim US30 açılır. VWAP açılıştan itibaren hesaplamaya başlar. Sabah boyunca VWAP YEŞİL kalır ve fiyat sürekli ondan sıçrar. Fiyat VWAP'a her dokunduğunda alırsınız. 4 işlem yaparsınız, hepsi kazançlı. Neden? Çünkü kurumlar tüm gün birikim yapıyordu ve siz onlarla birlikte adil fiyattan alıyordunuz.
Senaryo 2: Ortalama Dönüş Ticareti GBP/USD haberlerle +3σ bandına fırlar. Herkes heyecanlıdır. Siz KISA pozisyona girersiniz. Neden? Çünkü fiyat adil değerin 3 standart sapma üzerindedir - istatistikler VWAP'a dönmesi gerektiğini söyler. 30 dakika sonra fiyat VWAP'a geri döner. Siz 60 pip kar edersiniz, diğerleri kovalar.
Senaryo 3: Sahte Kırılmadan Kaçınma Altın günlük yüksek seviyesini kırar. Çoğu trader kırılmayı satın alır. Siz VWAP'a bakarsınız - KIRMIZI (düşüyor). Dışarıda kalırsınız. Fiyat geri döner ve 100 puan düşer. VWAP size kurumların almadığını söyledi - bu bir perakende tuzağıydı.
🎓 Bu Gösterge Kimler İçin?
✅ Günlük Traderlar - VWAP intraday için REFERANS çizgidir
✅ Scalperlar - VWAP dokunuşlarında mükemmel girişler
✅ Kurumsal Traderlar - Zaten VWAP kullanıyorlar, şimdi daha iyi görsellerle
✅ Akıllı Para Traderları - Büyük para akışını takip edin
✅ Ticarete Ciddi Yaklaşan Herkes - Profesyoneller böyle ticaret yapar
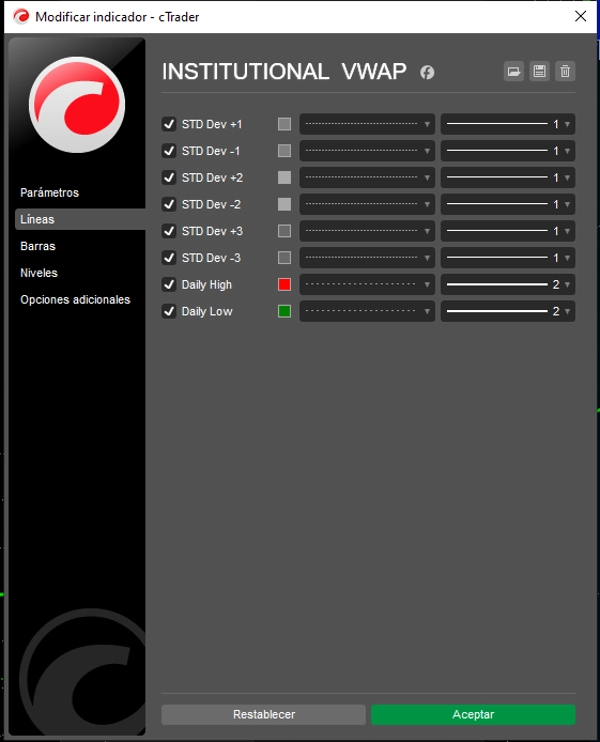
⚙️ Tamamen Özelleştirilebilir
- Oturum saatleri - Piyasanızın açılış/kapanış saatini ayarlayın (Londra, New York, Asya)
- Standart sapma bantları - 1, 2 veya 3 bant seçin
- Günlük yüksek/düşük - Aç/Kapa
- Görsel tercihler - Renkleri ve stilleri özelleştirin
🛡️ Dahili Risk Yönetimi
Standart sapma bantları RİSK YÖNETİMİNİZDİR:
Pozisyon Büyüklüğü:
- VWAP yakınında giriş = daha büyük pozisyon (daha düşük risk)
- ±2σ'da giriş = daha küçük pozisyon (daha yüksek risk)
- ±3σ'nın ötesinde asla giriş yapmayın (dönüşü bekleyin)
Stop Loss Yerleşimi:
- Uzun işlemler: VWAP'ın altında veya -1σ bandında
- Kısa işlemler: VWAP'ın üzerinde veya +1σ bandında
- Ortalama dönüş: İşlem yaptığınız aşırı bandın ötesinde
Kar Hedefleri:
- VWAP'tan ±1σ bandına (muhafazakar)
- VWAP'tan ±2σ bandına (ılımlı)
- ±3σ bandından VWAP'a dönüş (agresif ortalama dönüş)
🚀 Kaçırdığınız Ticaret Avantajı
VWAP ticarette en önemli üç soruya cevap verir:
✅ Adil değer nedir? - VWAP çizgisi
✅ Fiyat ucuz mu yoksa pahalı mı? - Sapma bantları
✅ Kurumlar alıyor mu yoksa satıyor mu? - VWAP'ın rengi (yeşil/kırmızı)
KURUMSAL VWAP ile artık tahmin yürütmüyorsunuz. Veri, istatistik ve kurumsal akışla ticaret yapıyorsunuz.
📈 Tüm Piyasalar ve Zaman Dilimlerinde Çalışır
- Forex - Her büyük ve küçük parite
- Endeksler - US30, SPX500, UK100, NAS100, GER40
- Emtialar - Altın, Gümüş, Petrol, Doğal Gaz
- Kripto Paralar - Bitcoin, Ethereum, Altcoinler
- Zaman Dilimleri - 1 dakikadan 1 saate (gün içi odak)
Not: VWAP öncelikle bir gün içi aracıdır. Her oturumda sıfırlanır, bu da onu günlük ticaret ve scalping için mükemmel yapar.
🎁 Kurumsal Zeka ile Ticaret Yapmaya Başlayın
Kör ticareti bırakın. Fiyatın "nerede olması gerektiğini" tahmin etmeyi bırakın. Bankaların ve hedge fonların kullandığı aynı referansla ticaret yapmaya başlayın.
Adil değeri görün. Uçları ticaret yapın. Kurumsal parayı takip edin.
Bu gösterge cTrader platformu ile uyumludur. Tek seferlik satın alma, ömür boyu güncellemeler dahildir.


