
Descrizione
COSA FA
Structural Supertrend affronta una limitazione fondamentale del Supertrend classico: cambia direzione nel momento in cui il prezzo chiude oltre la sua banda.
Nei trend puliti, questo funziona bene. In condizioni volatili o instabili, una singola candela aggressiva può innescare un cambio di direzione — anche quando il trend più ampio rimane strutturalmente intatto. Il risultato sono falsi segnali, uscite premature e rientri a prezzi peggiori.
Questo indicatore si basa su un presupposto diverso.
Il cambio di direzione avviene solo quando il prezzo conferma un vero cambiamento strutturale — non solo una chiusura momentanea oltre una soglia. Il risultato è meno inversioni false e un migliore allineamento con lo sviluppo reale dei trend.
Il Supertrend diventa strutturale. I segnali diventano significativi.
PERCHÉ STRUCTURAL SUPERTREND?
Il Problema
Il Supertrend originale considera ogni chiusura oltre la sua banda come un'inversione. Questo è intenzionale — rende l'indicatore reattivo per design. Ma la reattività ha un costo.
Durante le fasi di consolidamento, il prezzo spesso chiude oltre una banda per poi invertire immediatamente. Ognuno di questi genera un segnale di inversione, ogni inversione rappresenta una potenziale decisione di trading, e ciascuna rappresenta un'uscita da una posizione che non avrebbe dovuto essere chiusa.
I trader che hanno usato Supertrend abbastanza a lungo conoscono bene questa frustrazione.
La Soluzione
Structural Supertrend estende il modello originale per distinguere tra chiusure dovute alla volatilità e veri cambiamenti direzionali. Filtra il rumore richiedendo una conferma strutturale prima di cambiare la direzione del trend.
Meno inversioni. Migliore allineamento al trend. Meno reattivo alle singole candele.
Perché mantenere entrambi?
Il Supertrend originale appare ancora sul grafico — ma solo dove differisce da Structural. Questo design è intenzionale.
- Structural traccia la direzione del trend principale
- Original rivela il comportamento impulsivo e correttivo all'interno di quel trend
Quando entrambi concordano: forte convinzione direzionale. Quando divergono: il movimento è probabilmente correttivo, non una vera inversione. Questa visione a doppio livello fornisce un contesto che nessuna delle due linee offre da sola.
RILEVAMENTO INTEGRATO DEI SWING
Structural Supertrend include un sistema completo di rilevamento dei swing e un framework di supporto/resistenza — non come funzione secondaria, ma come estensione diretta dell'analisi strutturale.
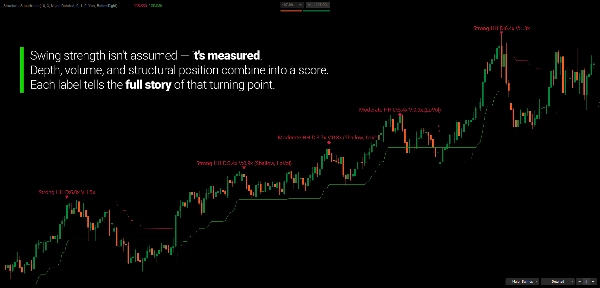
I swing sono identificati tramite un processo di qualificazione che privilegia la struttura: ogni candidato viene valutato in base a spostamento, conferma del volume e distanza relativa all'ATR prima di essere accettato. Questo mantiene la mappa dei swing focalizzata sui punti di svolta significativi piuttosto che su ogni estremo locale.
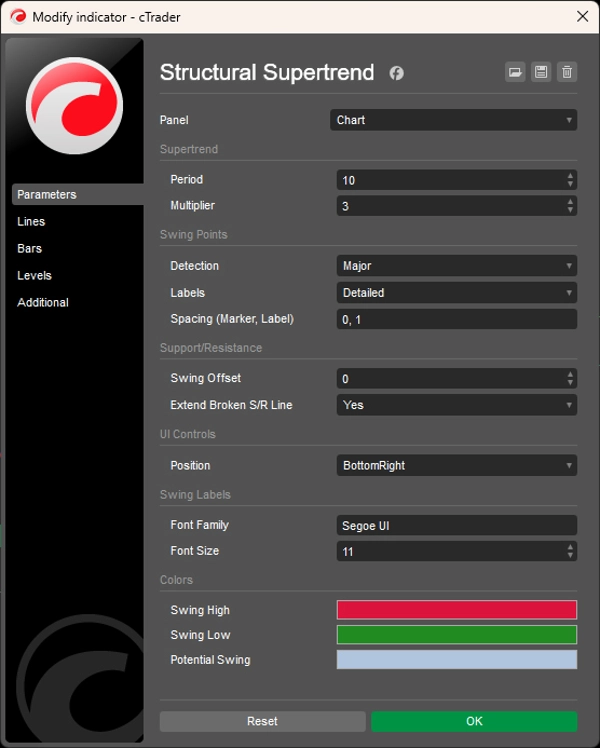
Tre modalità di rilevamento
- Minore — sensibilità aumentata, cattura i swing interni ai trend
- Bilanciata — granularità filtrata, migliore per la maggior parte degli usi
- Maggiore — solo i pivot strutturali più forti, confermati da criteri più ampi
Classificazione della forza del swing
Ogni swing confermato viene valutato in base a profondità, volume e posizione strutturale rispetto al precedente swing dello stesso tipo. La forza è classificata dinamicamente usando il ranking percentuale rispetto alla storia recente degli swing — non soglie fisse. I marcatori visivi riflettono la classificazione: triangoli per forte, diamanti per moderato, cerchi per debole.
Zone di supporto/resistenza con tracciamento della polarità
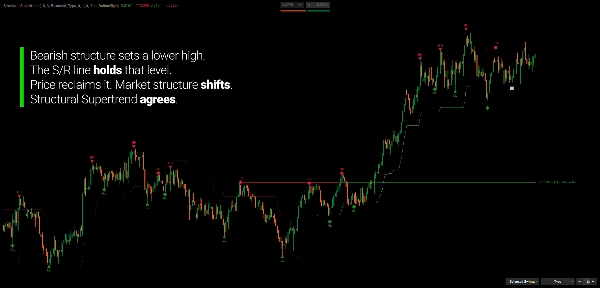
Gli swing confermati diventano livelli attivi di supporto/resistenza che tracciano la loro storia di interazione. Quando il prezzo visita nuovamente un livello, l'indicatore registra se il contatto è stato un rifiuto della candela (wick rejection) o una rottura del corpo. Quando un livello viene spazzato via e chiude oltre di esso, la polarità cambia — la resistenza diventa supporto e viceversa. Se viene spazzato di nuovo, la zona viene invalidata.
Le etichette di età mostrano da quanto tempo ogni livello è attivo e quante volte è stato testato.
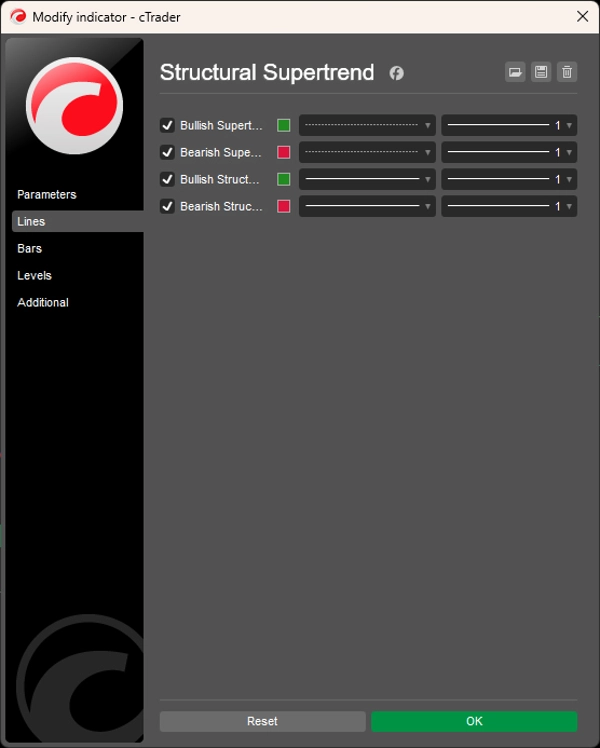
LEGGERE IL GRAFICO
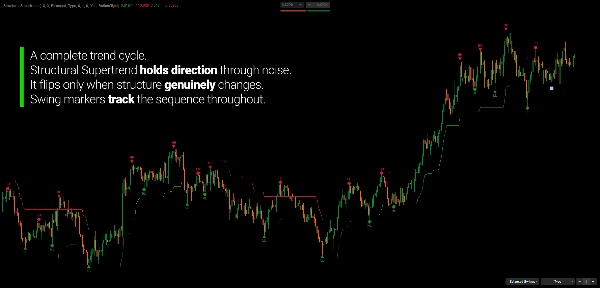
- Linea Strutturale Verde: Trend strutturale rialzista (supporto dinamico)
- Linea Strutturale Rossa: Trend strutturale ribassista (resistenza dinamica)
- Linea Puntinata: Supertrend originale — visibile solo dove differisce da Structural
- Linee S/R: Livelli attivi con stato di polarità ed età
Controllo di allineamento del trend:
- Struttura + Originale concordano → Movimento direzionale ad alta convinzione
- Struttura + Originale divergono → Probabile fase correttiva o transitoria
A CHI È RIVOLTO
Questo indicatore è per i trader che vogliono leggere la direzione del trend e la struttura del mercato da un unico framework coerente.
Se hai usato il Supertrend classico e lo hai trovato troppo reattivo — che cambia spesso direzione durante condizioni laterali — Structural Supertrend è stato creato proprio per risolvere questo problema.
È adatto a trader di trend e swing che vogliono una lettura direzionale più pulita senza continue inversioni false, trader basati sulla struttura che seguono le sequenze di swing per validare la salute del trend, e trader discrezionali che usano i livelli di supporto/resistenza come contesto per entrate, uscite e gestione della posizione.
I controlli UI integrati lo rendono pratico per l'uso in tempo reale: cambia modalità di rilevamento, regola i riferimenti S/R e attiva/disattiva il dettaglio delle etichette direttamente sul grafico — senza bisogno di aprire il pannello delle impostazioni.
Non è un generatore di segnali. È un framework di analisi strutturale per trader che vogliono capire dove si trova il mercato, non solo cosa sta facendo in questo momento.
COSA LO RENDE DIVERSO
La maggior parte delle implementazioni di Supertrend considera ogni chiusura oltre una banda come azionabile. Questo la considera come un candidato — e richiede prove strutturali prima di impegnarsi in un cambio di direzione.
La maggior parte dei rilevatori di swing identifica massimi e minimi locali senza criteri di valutazione. Questo qualifica ogni swing in base a spostamento, volume e posizione strutturale — e valuta la forza dinamicamente rispetto alla storia recente degli swing.
La maggior parte degli strumenti di supporto/resistenza traccia una linea e la lascia. Questo traccia la storia delle interazioni, segnala i cambi di polarità e continua a evolversi man mano che il mercato visita ogni livello.
Il risultato: uno strumento di trend e struttura che resta rilevante più a lungo, reagisce meno al rumore e costruisce un quadro più ricco della condizione di mercato nel tempo.
---
COMPRENDERE L'ANALISI STRUTTURALE
La struttura del mercato non riguarda trovare lo "swing giusto" o la "direzione corretta" del trend. Si tratta di mantenere un quadro obiettivo di come si stanno sviluppando le sequenze di prezzo — e se quella sequenza rimane coerente o sta iniziando a degradarsi.
Un trend non è definito da una singola mossa ma da una serie di relazioni: massimi e minimi più alti nei trend rialzisti, massimi e minimi più bassi nei trend ribassisti. Ogni nuovo swing conferma o sfida la sequenza esistente. Quando la conferma continua, la struttura è intatta. Quando si rompe, la struttura sta cambiando.
Ciò che rende utile l'analisi strutturale non è che predice dove andrà il prezzo, ma che descrive dove il prezzo si trova attualmente nella sua sequenza. Questa distinzione è importante. La previsione richiede assunzioni sul futuro. L'osservazione strutturale richiede solo una lettura accurata di ciò che è già accaduto.
Gli indicatori basati sulla logica strutturale sono progettati per supportare questa osservazione — per rendere la sequenza visibile e tracciabile senza introdurre interpretazioni soggettive. L'obiettivo è chiarezza sulla condizione attuale del mercato, non certezza sulla direzione futura del prezzo.
---
Il trading comporta rischi. Questo indicatore è uno strumento di analisi tecnica — applica sempre una corretta gestione del rischio.
Riepilogo
Recensioni dei clienti
5 | 67 % | |
4 | 33 % | |
3 | 0 % | |
2 | 0 % | |
1 | 0 % |


