
(ViPi) MTF Candles
อินดิเคเตอร์
106 ดาวน์โหลด
เวอร์ชัน 1.0, Feb 2026
Windows, Mac
คำอธิบาย
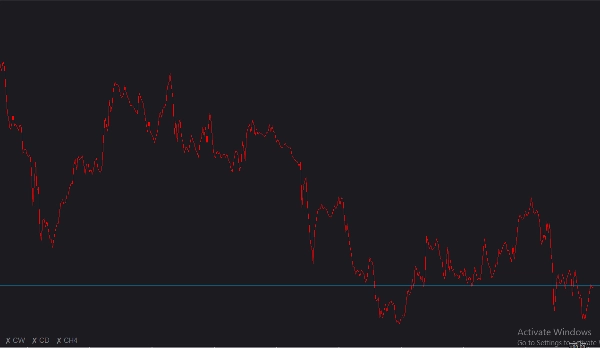
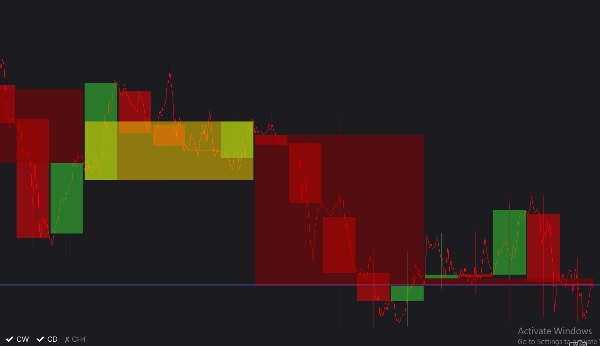
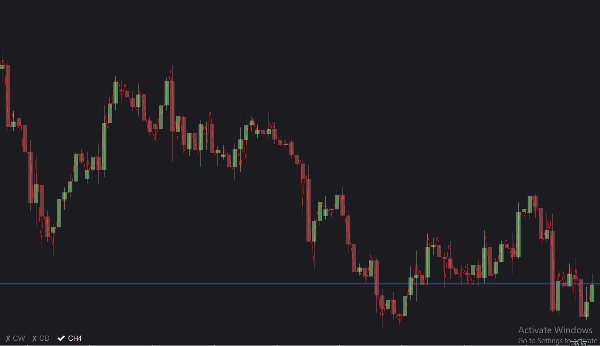
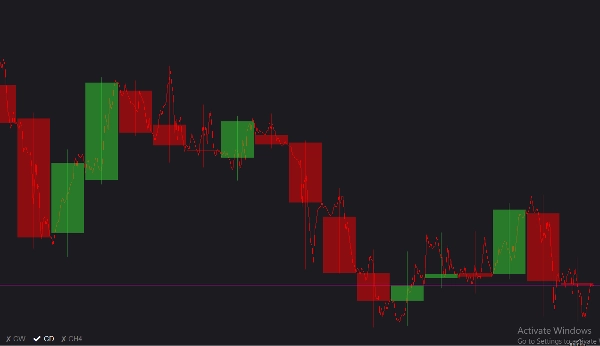
บทนำโดยละเอียด (ViPi) MTF Candles เป็นเครื่องมือแผนภูมิที่มีการโต้ตอบสูงและปรับแต่งได้ ออกแบบมาเพื่อให้เทรดเดอร์มุมมองตลาดแบบบนลงล่างโดยไม่ต้องออกจากแผนภูมิที่ใช้งานอยู่ ด้วยการซ้อนทับเทียน MTF ที่แตกต่างกันสูงสุดสามช่วงเวลาบนมุมมองปัจจุบันของคุณอย่างราบรื่น คุณสามารถสังเกตแนวโน้มเศรษฐกิจมหภาค ระดับแนวรับ/แนวต้านที่สำคัญ และการเปลี่ยนแปลงของตลาดได้อย่างง่ายดาย ฟีเจอร์นี้มีเมนูสลับบนแผนภูมิที่ดูเรียบง่ายและไม่รบกวน ซึ่งช่วยให้คุณซ่อนหรือแสดงแต่ละช่วงเวลาได้ทันที เพื่อให้พื้นที่ทำงานของคุณสะอาดและมีสมาธิ
รายการพารามิเตอร์ทั้งหมด
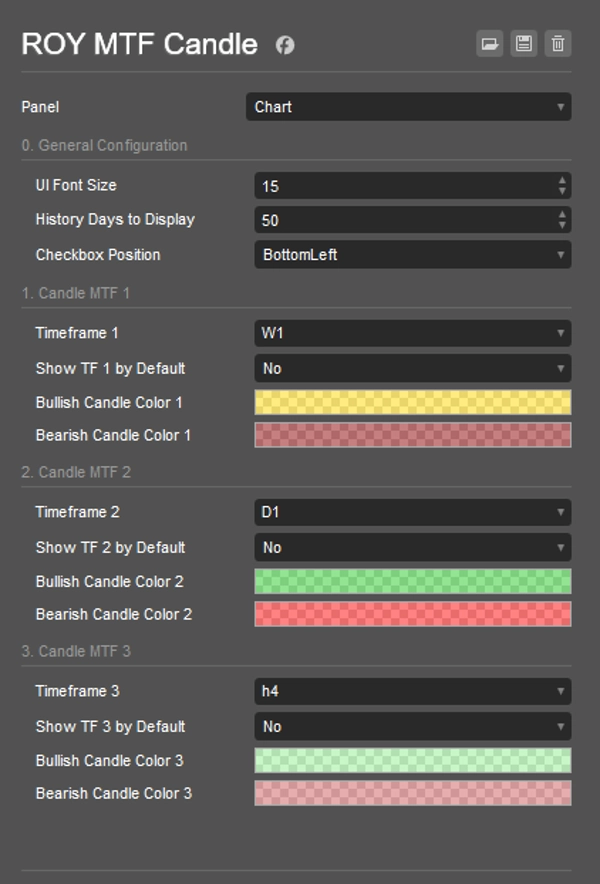
- ขนาดตัวอักษร UI: ปรับขนาดข้อความสำหรับปุ่มสลับแบบโต้ตอบบนแผนภูมิ สามารถตั้งค่าได้ระหว่าง 8 ถึง 30 (ค่าเริ่มต้น: 11)
- จำนวนวันที่แสดงประวัติ: กำหนดจำนวนวันที่ตัวบ่งชี้จะวาดเทียน MTF ในอดีต (ค่าเริ่มต้น: 50 วัน)
- ตำแหน่งกล่องกาเครื่องหมาย: ให้คุณยึดเมนูสลับ UI ไปที่มุมใดก็ได้ของแผนภูมิ: มุมบนซ้าย, มุมบนขวา, มุมล่างซ้าย หรือ มุมล่างขวา (ค่าเริ่มต้น: มุมล่างซ้าย)
- ช่วงเวลา 1, 2, 3: ช่วงเวลาที่สูงกว่าที่คุณต้องการติดตาม (ค่าเริ่มต้นคือ รายสัปดาห์ รายวัน และ 4 ชั่วโมง ตามลำดับ)
- แสดง TF 1, 2, 3 โดยค่าเริ่มต้น: สลับว่าขี้ผึ้งของแต่ละช่วงเวลาจะมองเห็นได้ทันทีเมื่อใช้ตัวบ่งชี้กับแผนภูมิหรือไม่ (ค่าเริ่มต้น: ไม่ใช่)
- สีเทียนกระทิง/หมี: อนุญาตให้ปรับแต่งสีของเทียนขึ้นและลงสำหรับแต่ละช่วงเวลาทั้งสามได้อย่างสมบูรณ์ พร้อมรองรับความโปร่งใสเพื่อไม่ให้บดบังแผนภูมิหลักของคุณ
คู่มือการใช้งาน
- แนบกับแผนภูมิ: โหลดตัวบ่งชี้ (ViPi) MTF Candles ลงในพื้นที่ทำงาน cTrader ที่ใช้งานอยู่ของคุณ
- กำหนดค่าช่วงเวลา: เปิดการตั้งค่าและเลือกช่วงเวลามาโครสูงสุดสามช่วง (เช่น รายสัปดาห์ รายวัน และ H4) ที่คุณต้องการติดตามควบคู่กับช่วงเวลาปัจจุบันของคุณ
- ปรับแต่งภาพ: ปรับสีและความโปร่งใสของเทียนกระทิงและหมีในแต่ละช่วงเวลาเพื่อให้มีความแตกต่างกับพื้นหลังของคุณอย่างสวยงาม
- สลับการมองเห็นได้ทันที: ใช้ปุ่มโต้ตอบบนแผนภูมิที่สะดวก (ตั้งอยู่ที่ตำแหน่งกล่องกาเครื่องหมายที่คุณเลือก) เพื่อคลิกและสลับการซ้อนทับ MTF เฉพาะได้อย่างรวดเร็วในขณะที่คุณทำการวิเคราะห์
สรุป
สรุปโดย AI
(ViPi) MTF Candles is a charting indicator for cTrader that overlays up to three higher timeframe (multi-timeframe, MTF) candlestick charts directly onto the current chart. This tool enables traders to analyze broader market trends, key support and resistance levels, and shifts in market sentiment without switching charts. Users can customize the displayed timeframes—commonly Weekly, Daily, and 4-hour—and adjust the number of historical days shown. The indicator includes an on-chart toggle menu, which can be positioned in any corner of the chart, allowing quick visibility control of each timeframe overlay. Visual customization options include adjustable font sizes for toggle buttons and configurable bullish/bearish candle colors with transparency settings to maintain chart clarity. This facilitates a streamlined, interactive top-down market perspective suitable for various markets including Forex, indices, commodities, stocks, and cryptocurrencies.
โปรไฟล์อินดิเคเตอร์
รีวิวจากลูกค้า
0.0
รีวิว: 0
รีวิวจากลูกค้า
ยังไม่มีรีวิวสำหรับผลิตภัณฑ์นี้ หากเคยลองแล้ว ขอเชิญมาเป็นคนแรกที่บอกคนอื่น!
การสนทนา
คำถามที่พบบ่อย
BTCUSD
Forex
Indices
EURUSD
Commodities
GBPUSD
NZDUSD
Crypto
Stocks
XAUUSD
NAS100
USDJPY
ผลิตภัณฑ์ที่มีให้บริการผ่าน cTrader Store รวมถึงบอทการเทรด อินดิเคเตอร์ และปลั๊กอิน มีให้บริการโดยนักพัฒนาบุคคลที่สามและมีไว้เพื่อวัตถุประสงค์ในการเข้าถึงข้อมูลและทางเทคนิคเท่านั้น cTrader Store ไม่ใช่โบรกเกอร์และไม่ได้ให้คำแนะนำการลงทุน คำแนะนำส่วนบุคคล หรือการรับประกันผลการดำเนินงานในอนาคต
เพิ่มเติมจากผู้เขียนคนนี้


ราคา
ตั้งแต่ 12/06/2025
1
การขาย
336
ติดตั้งฟรี