present
ลงทะเบียนและรับส่วนลด $50 สำหรับการซื้อครั้งแรกของคุณ
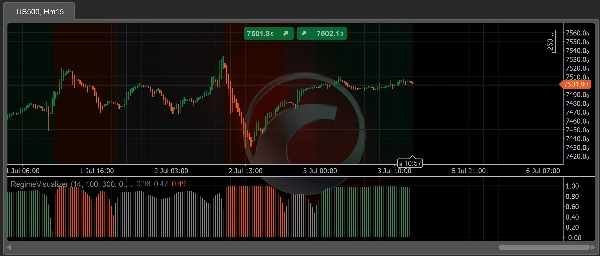
Trading product for RegimeVisualizer อินดิเคเตอร์ Flag Volume, image 1
RegimeVisualizer
อินดิเคเตอร์
เวอร์ชัน 1.0, Jul 2026
Windows, Mac
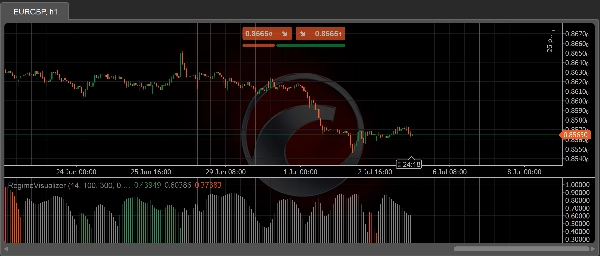
Trading product for RegimeVisualizer อินดิเคเตอร์ Flag Volume, image 2
Trading product for RegimeVisualizer อินดิเคเตอร์ Flag Volume, image 3
Trading product for RegimeVisualizer อินดิเคเตอร์ Flag Volume, image 4
Trading product for RegimeVisualizer อินดิเคเตอร์ Flag Volume, image 5
ตั้งแต่ 11/01/2025
14.87M
ปริมาณการเทรด
1.06M
Pips ที่ได้กำไร

คำอธิบาย

The problem with regime indicators: they change their minds.

Most regime indicators "learn" from the data while they run. You know the result: the history looks beautiful, because the labels of past bars were silently rewritten after the future arrived. This has a name — repainting — and it is the cardinal sin of any analysis tool: it looks reliable precisely because it erases its own mistakes.

Regime Visualizer makes a single promise: it never repaints.

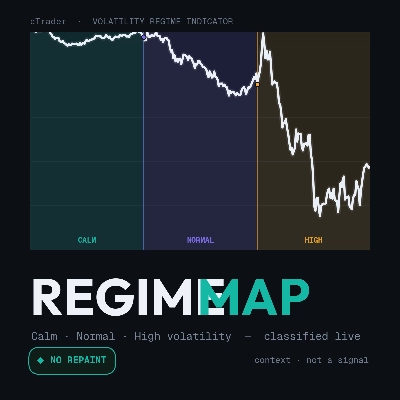
Every bar is classified into one of three volatility regimes — Calm, Normal or High — at the moment it closes. That label is final. It is never recalculated, smoothed or retroactively corrected. The screenshot you take today shows the same thing that was on the screen live, bar by bar. Deterministic: same data, same picture, on every run.

What you see on the chart:

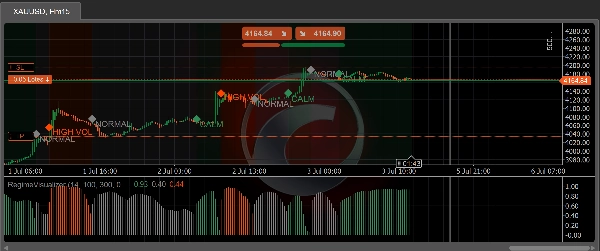
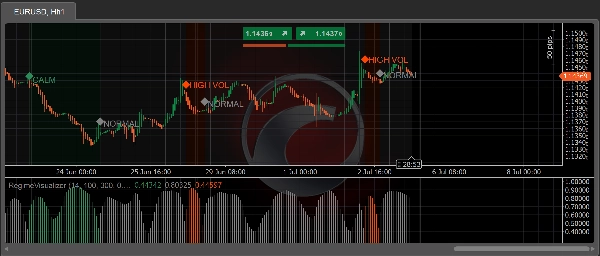
  • 🎨 Colored background per regime segment, right on the price chart
  • 📊 Confidence histogram (0–1) in a separate panel — the filtered probability of the active regime, in the regime's color
  • 🔷 Transition marker — icon + label on the bar where the regime changes
  • Each layer toggles on/off independently, with configurable colors

What it is NOT (read before installing):

  • ❌ Not a trading signal. It never tells you to buy or sell.
  • ❌ No performance promise. Volatility regime does not predict profit — this indicator makes context readable, nothing more. What you do with it is your responsibility.
  • ❌ Not adaptive. There is no online learning — on purpose: "learning while running" is exactly what makes regime indicators repaint.

How it works (for those who want to know):

A 3-state hidden Markov model (HMM) with fixed parameters runs on normalized ATR (ATR(14) / 100-bar ATR average — dimensionless, so it works on any instrument and timeframe). Inference is forward filtering only — it uses nothing but data up to the close of the current bar, with no Viterbi and no backward smoothing (the classic sources of repainting). A hysteresis layer with thresholds and a minimum dwell time turns the flickering argmax into a stable read.

Honest about its limits:

  • The first 300 bars (warmup) stay unlabeled — the indicator does not pretend to know what it does not know yet.
  • The forming bar gets no label — it is classified when it closes. That is the price of never repainting, and we pay it in front of you.

For cBot developers:

The indicator exposes the public RegimeCode series (0 = Calm, 1 = Normal, 2 = High, −1 = warmup) for consumption via Indicators.GetIndicator<RegimeVisualizer>(). Non-repainting volatility context, ready to plug into your logic.

Validation (tested, not claimed):

The non-repaint property was verified by a harness that reprocessed 100,000 real bars across 201 incremental windows — 10.1 million label comparisons, zero divergence — plus bit-identical determinism across runs.

Free. Context — not a signal.

สรุป

โปรไฟล์อินดิเคเตอร์
หมวดหมู่อินดิเคเตอร์
ปริมาณ
ประเภทเอาต์พุต
การแสดงเป็นภาพ
ข้อกำหนดด้านข้อมูล
แท่งเท่านั้น
สัญญาณที่รองรับ
ความผันผวน

การสนทนา

รีวิวจากลูกค้า

0.0
รีวิว: 0
รีวิวจากลูกค้า
ยังไม่มีรีวิวสำหรับผลิตภัณฑ์นี้ หากเคยลองแล้ว ขอเชิญมาเป็นคนแรกที่บอกคนอื่น!

คำถามที่พบบ่อย

Flag
Volume
Market Structure
Supply & Demand
Risk Dashboard
ATR
Liquidity Grab
ผลิตภัณฑ์ที่มีให้บริการผ่าน cTrader Store รวมถึงบอทการเทรด อินดิเคเตอร์ และปลั๊กอิน มีให้บริการโดยนักพัฒนาบุคคลที่สามและมีไว้เพื่อวัตถุประสงค์ในการเข้าถึงข้อมูลและทางเทคนิคเท่านั้น cTrader Store ไม่ใช่โบรกเกอร์และไม่ได้ให้คำแนะนำการลงทุน คำแนะนำส่วนบุคคล หรือการรับประกันผลการดำเนินงานในอนาคต

นอกจากนี้คุณยังอาจชอบ

อินดิเคเตอร์
AI
This Indicator is a technical analysis tool that measures the strength and direction of market sentiment
อินดิเคเตอร์
Key Levels
Market Structure
+1
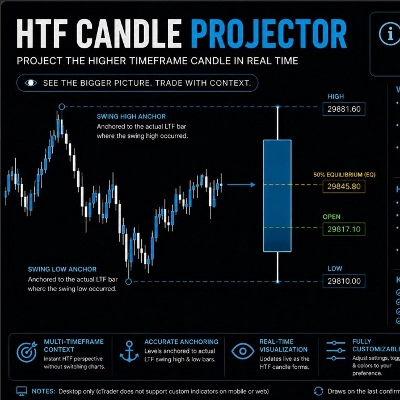
HTF Candle Projector displays the current Higher Timeframe candle (4H or 1H) as a real projected candle LIVE..
อินดิเคเตอร์
ATR
SMC
+18
Precision SMC tool with HTF sweeps, MSS confirmation & smart FVG detection for high-probability reversals.
อินดิเคเตอร์
Supertrend
Moving Average
Adaptive MA anchored to structural trend changes — no fixed period. Dual Supertrend + swing detection.
"TrendMagicOptimized" โลโก้
เรตติ้งสูง
4.5
(4)
$19
/
$20
อินดิเคเตอร์
Clean trend indicator using CCI & ATR. Highlights up/down trends with adaptive, no-repaint lines.
อินดิเคเตอร์
RSI
VWAP
+5
Trend direction, chart signals, reversal zones and volume tools in one configurable indicator.
อินดิเคเตอร์
Volume
Supply & Demand
ORDER BOOK TRACKS SMART MONEY IN REAL TIME!
อินดิเคเตอร์
Volume
Key Levels
View tick activity across a selected chart range with Point of Control, Value Area High and Value Area Low.
อินดิเคเตอร์
SMC
Prop
+14
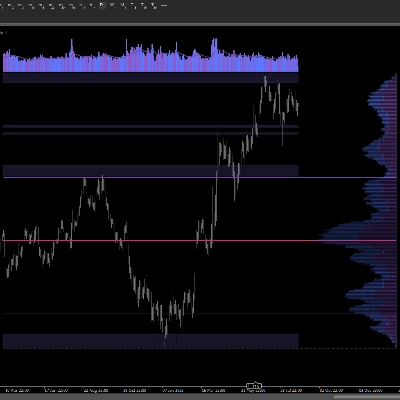
Right-anchored cTrader Volume Profile with VAH/VAL/POC, LVZ, top volume+EMA, themes, and fast, readable visuals.
อินดิเคเตอร์
ATR
Volume
+3
Volume profile key levels - POC, value area, volume peaks and troughs - with break, rejection and retest signals
อินดิเคเตอร์
ATR
Wedge
+2
Strong Supertrend Turn Market Movement into a Clear Map Market analysis
"CVD Ai" โลโก้
ยอดนิยม
4.0
(2)
$35
/
$49
อินดิเคเตอร์
AI
ATR
+5
"Advanced VSA & CVD indicator with 'A+ Setup' filtering based on Support & Resistance levels."
อินดิเคเตอร์
Forex
Signal
+4
Gann Pivot Vision is an innovative analytical tool that combines classic pivot reversal levels and Gann geometry
"Major Tops and Bottoms" โลโก้
เรตติ้งสูง
4.2
(4)
$29
อินดิเคเตอร์
Signal
Scalping
Average accuracy of around 60% to 70% on 45min timeframes it is highly recommended to use stop losses
อินดิเคเตอร์
Forex
Signal
Market Session BT
อินดิเคเตอร์
ATR
BOS
+5
Market structure with BOS and CHoCH, order blocks, and retest buy/sell arrows with entry, stop and two targets
"OrderPrice-V3" โลโก้
เรตติ้งสูง
4.0
(4)
$19
อินดิเคเตอร์
RSI
MACD
+2
A straightforward yet effective tool signals entry points for both buying and selling. Include 3 Moving Average
"FractalArrowBuySell" โลโก้
ยอดนิยม
4.3
(3)
$20
/
$39
อินดิเคเตอร์
Signal
Fractal Arrow Buy and Sell Indicator

ราคา

ตั้งแต่ 11/01/2025
14.87M
ปริมาณการเทรด
1.06M
Pips ที่ได้กำไร