
คำอธิบาย
✔ เว็บไซต์สำหรับป้อนข้อมูล, ไปที่แท็บดัชนี: https://tradingeconomics.com/
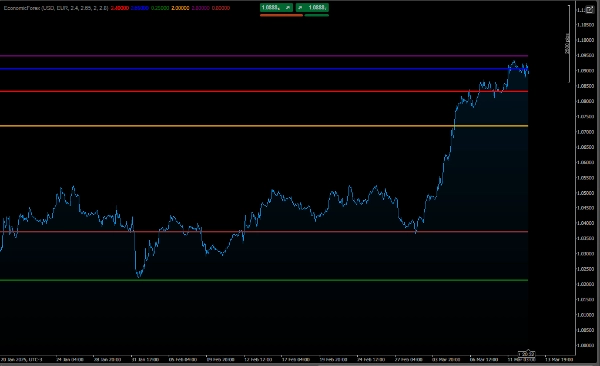
วิธีการตีความกราฟ
ความแตกต่างระหว่างอัตราดอกเบี้ยชื่อหน้าและอัตราดอกเบี้ยที่แท้จริง:
อัตราดอกเบี้ยชื่อหน้าเป็นมูลค่ารวมของอัตราดอกเบี้ย
อัตราดอกเบี้ยที่แท้จริงคำนึงถึงเงินเฟ้อ แสดงถึงอำนาจซื้อที่แท้จริงของเงิน
ถ้าเงินเฟ้อสูงกว่าอัตราดอกเบี้ยชื่อหน้า อัตราดอกเบี้ยที่แท้จริงจะเป็นลบ ซึ่งบ่งชี้ถึงการสูญเสียอำนาจซื้อ
การเปรียบเทียบสกุลเงิน:
กราฟช่วยให้คุณเปรียบเทียบสภาพเศรษฐกิจของสกุลเงินทั้งสอง
ตัวอย่างเช่น หากอัตราดอกเบี้ยที่แท้จริงของสกุลเงินหลักสูงกว่าอัตราของสกุลเงินคู่ อาจบ่งชี้ว่าสกุลเงินหลักน่าสนใจสำหรับการลงทุนมากกว่า
วิวัฒนาการตามเวลา:
เส้นกราฟแสดงให้เห็นว่าเงินเฟ้อ อัตราดอกเบี้ยชื่อหน้า และอัตราดอกเบี้ยที่แท้จริงเปลี่ยนแปลงไปตามเวลาอย่างไร ช่วยให้คุณระบุแนวโน้มได้
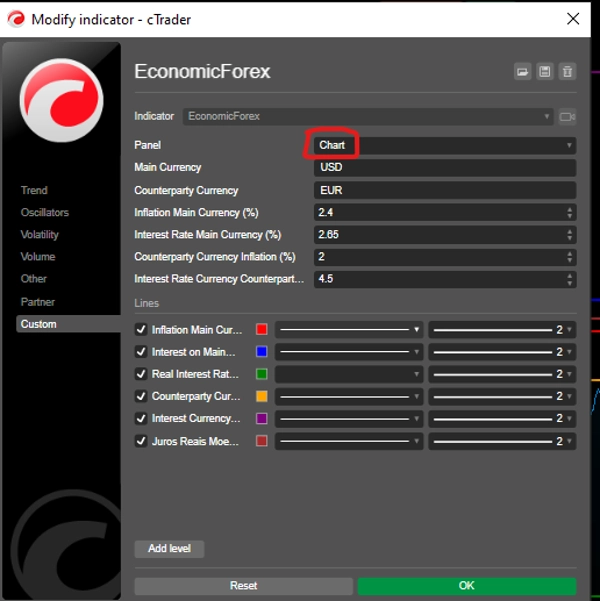
ตัวอย่างการใช้งาน
สมมติว่าคุณตั้งค่าพารามิเตอร์ดังนี้:
สกุลเงินหลัก: USD (ดอลลาร์สหรัฐ)
เงินเฟ้อ: 5%
อัตราดอกเบี้ยชื่อหน้า: 6.5%
สกุลเงินคู่: EUR (ยูโร)
เงินเฟ้อ: 2%
อัตราดอกเบี้ยชื่อหน้า: 4%
กราฟจะแสดง:
USD:
อัตราดอกเบี้ยที่แท้จริง: 1.5% (6.5% - 5%)
EUR:
อัตราดอกเบี้ยที่แท้จริง: 2% (4% - 2%)
ด้วยข้อมูลนี้ คุณสามารถเปรียบเทียบสภาพเศรษฐกิจของ USD และ EUR และตัดสินใจอย่างมีข้อมูลในตลาดฟอเร็กซ์
บทสรุป
โค้ดนี้เป็นเครื่องมือที่มีประโยชน์สำหรับเทรดเดอร์และนักวิเคราะห์ที่ต้องการติดตามและเปรียบเทียบดัชนีเศรษฐกิจของสกุลเงินสองสกุลในคู่ฟอเร็กซ์ มันให้ข้อมูลเชิงลึกเกี่ยวกับเงินเฟ้อ อัตราดอกเบี้ยชื่อหน้า และอัตราดอกเบี้ยที่แท้จริง ช่วยให้เข้าใจสถานการณ์เศรษฐกิจมหภาคและผลกระทบต่อ ตลาดฟอเร็กซ์
ดูอัลกอริทึมความเสี่ยงต่ำนี้:👇🏻
https://ctrader.com/pt/products/601?u=carneiroads
https://ctrader.com/pt/products/623?u=carneiroads
สรุป
The indicator distinguishes between nominal interest rates (the gross interest rate) and real interest rates (adjusted for inflation), highlighting the purchasing power of money. It allows comparison of economic conditions between a main currency and a counterparty currency by plotting their respective inflation, nominal, and real interest rates over time. This helps identify trends and relative investment attractiveness; for example, a higher real interest rate in the main currency compared to the counterpart may indicate greater investment appeal.
Users input data such as inflation and nominal interest rates for each currency, which can be sourced from economic data websites like TradingEconomics.com. The tool supports informed decision-making in the forex market by providing a clear view of evolving economic factors affecting currency pairs.


