Deskripsi
BullBear Dynamics — Indikator Tren & Momentum untuk cTrader
BullBear Dynamics adalah indikator yang kuat dan sadar volatilitas untuk platform cTrader, dirancang untuk membantu trader mendeteksi dan menginterpretasikan keseimbangan antara momentum bullish dan bearish di pasar. Ini menggabungkan moving average, normalisasi ATR, dan ambang dinamis untuk menyediakan alat yang tepat dan intuitif secara visual untuk penilaian tren.
Metodologi & Logika Internal
Indikator menghitung dua Exponential Moving Averages (EMA): EMA jangka pendek dan EMA jangka panjang.
Kemudian mengambil selisih antara EMA tersebut dan membaginya dengan Average True Range (ATR). Normalisasi ini membantu menyesuaikan sinyal momentum sehubungan dengan volatilitas pasar saat ini.
Garis sinyal — sebuah EMA yang diterapkan pada nilai yang dinormalisasi — menyaring noise dan meratakan fluktuasi kecil.
Untuk membedakan pergerakan lemah dari yang kuat, alat ini menghitung deviasi standar bergulir (StdDev) selama jendela lookback dan mengalikannya dengan faktor untuk menentukan ambang atas dan bawah.
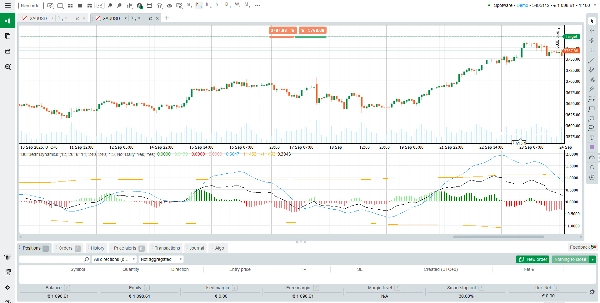
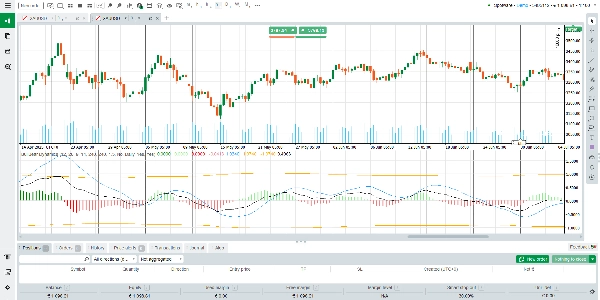
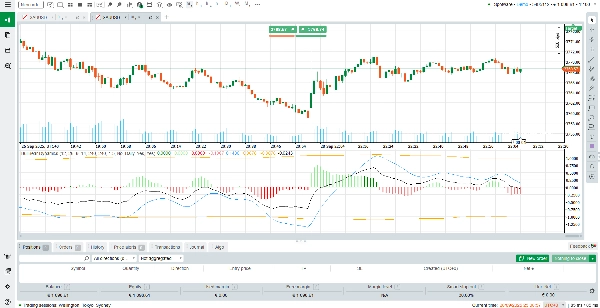
Output akhir divisualisasikan sebagai histogram (dengan beberapa status warna) plus garis sinyal dan batas ambang.
Cara Membaca & Menginterpretasikan Output
Batang Histogram (Hijau / Merah):
• Hijau menunjukkan momentum bullish; merah menunjukkan momentum bearish.
• Warna kuat (lebih cerah atau penuh) berarti histogram melewati ambang — menandakan pergerakan yang kuat.
• Warna lebih lemah berarti histogram tetap di dalam batas ambang — menandakan momentum ringan atau noise.
Garis Sinyal:
• Berfungsi sebagai garis dasar referensi.
• Ketika histogram melintasi di atas garis sinyal, ini menandakan potensi penguatan momentum bullish.
• Ketika melintasi di bawah, menandakan potensi penguatan momentum bearish.
Garis Ambang (Atas & Bawah):
• Garis putus-putus ini mendefinisikan zona penting.
• Batang histogram yang melewati ambang menandakan pergerakan momentum yang kuat dan sangat dapat dipercaya.
• Batang yang tetap di dalam ambang menunjukkan rentang atau ketidakpastian — sinyal kurang dapat diandalkan.
Skenario & Bacaan:
Momentum bullish — batang hijau di atas garis sinyal, sebaiknya juga melewati ambang atas.
Momentum bearish — batang merah di bawah garis sinyal, sebaiknya juga melewati ambang bawah.
Netral / rentang — batang berosilasi di dalam ambang, warna bisa bergantian, amplitudo kecil.
Perubahan atau pembalikan momentum — histogram melintasi garis sinyal, disertai perubahan warna; jika juga melewati ambang, lebih dapat diandalkan.
Saran Penggunaan & Praktik Terbaik
Gunakan BullBear Dynamics bersama dengan alat lain (filter tren, support/resistance, analisis pola) untuk konfirmasi.
Berhati-hatilah dalam menginterpretasikan sinyal selama periode volatilitas rendah ketika batang histogram tetap di dalam ambang.
Prioritaskan sinyal di mana histogram melintasi garis sinyal dan melewati ambang.
Konfirmasi keselarasan arah pada timeframe yang lebih tinggi sebelum bertindak berdasarkan sinyal timeframe yang lebih rendah.
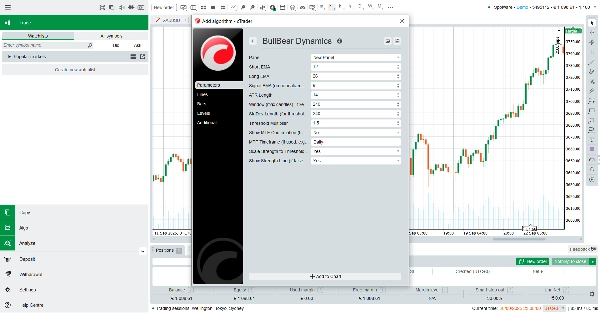
Sesuaikan parameter (panjang EMA, pengali ambang, jendela StdDev) sesuai kebutuhan untuk berbagai pasar (Forex, indeks, komoditas, kripto).
Fitur Utama & Sorotan
Normalisasi Adaptif Volatilitas — momentum diskalakan oleh ATR, sehingga sinyal lebih dapat diandalkan di berbagai kondisi pasar.
Ambang Dinamis — dibangun dari deviasi standar bergulir, menyesuaikan dengan kondisi pasar yang berlaku, membantu mengurangi false break.
Histogram Multi-Warna yang Jelas — membedakan secara visual antara momentum kuat vs lemah, dan bullish vs bearish.
Kompatibilitas Luas — bekerja pada semua instrumen dan timeframe yang didukung oleh cTrader.
Gratis untuk Digunakan — tersedia tanpa biaya; ideal untuk trader yang menginginkan kemampuan indikator lanjutan tanpa berlangganan.
Ringkasan
The output is displayed as a multi-color histogram with green bars indicating bullish momentum and red bars indicating bearish momentum. The intensity of the colors reflects the strength of the momentum relative to dynamically calculated upper and lower thresholds. The signal line serves as a baseline to identify potential momentum shifts when the histogram crosses it. Threshold lines mark zones of significant momentum moves, with bars crossing these lines signaling stronger trends.
BullBear Dynamics supports all instruments and timeframes available on cTrader, including Forex, commodities, indices, and cryptocurrencies. It is recommended to use this indicator alongside other analysis tools for confirmation and to adjust its parameters to fit different market conditions and trading styles such as scalping.
Ulasan pelanggan
5 | 100 % | |
4 | 0 % | |
3 | 0 % | |
2 | 0 % | |
1 | 0 % |