
Deskripsi
Indikator Toko Pinescriptlabs: Toko cBots Pinescriptlabs : (cBot) Gold & BTC BreakoutSession Pivots(baru)
Struktur Pasar Lanjutan: Bos, Choch, SwinLevels, Order Blocks, Pencari Struktur Pasar & Likuiditas (Baru)
Proyeksi Likuiditas Harga ZigZag
Algoritma Pintar Trailing (baru)
Prediksi Berdasarkan Linreg & ATR
SmartTrend Dukungan &
Perlawanan
Garis
Dinamis
Analisis Struktur Pasar
dari
Titik
Pembalikan
Fibonacci
Regresi
Linear
Multi-timeframe
Multi-Level
Pelacak Bias Lilin
Tracker
Otomatis
Dukungan dan
Perlawanan
Garis
Lines
Semua
Dukungan dan
Perlawanan
Level
🌟 Upaya hebat dari tim untuk mengembangkan indikator Ctrader ini! Dukung kami dengan membagikan - peningkatan visual termasuk gulir horizontal segera hadir!
⚠️ Catatan Teknis: Zoom/gulir manual saat ini diperlukan untuk tampilan optimal ("Batasan sementara: Bekerja terbaik pada timeframe di bawah 1H karena keterbatasan visual platform Ctrader")
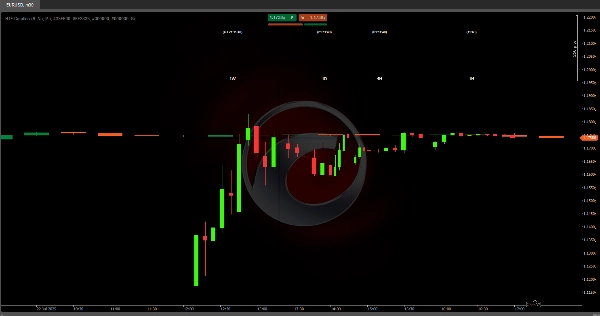
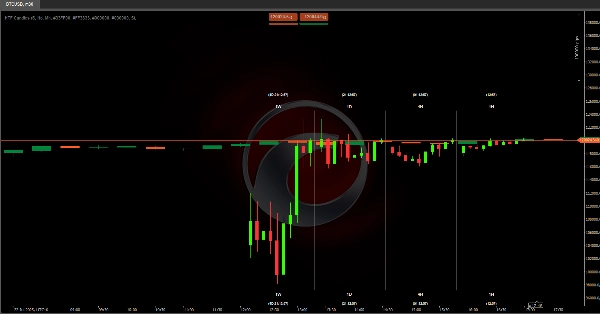
📊 Visualisasi HTF Waktu Nyata
Algoritma ini menampilkan lilin timeframe lebih tinggi (1M, 1H, 4J, 1J) langsung di grafik trading Anda, memberikan struktur pasar lengkap sekilas - tanpa perlu berganti jendela!
🔍 Analisis Cepat
Temukan tren utama (arah harian/mingguan) saat trading timeframe lebih rendah
• Fitur Lanjutan: lilin HTF diperbarui secara real-time - perubahan warna langsung menunjukkan pergeseran momentum
⚙️ Cara Menggunakan
• Aktifkan/nonaktifkan blok HTF individual
• Sesuaikan lilin yang terlihat (1-10 per timeframe)
💡 Manfaat Mengubah Permainan
Sekarang Anda dapat:
1️⃣ Mengantisipasi penutupan lilin kunci
2️⃣ Mendeteksi pembalikan tren secara langsung
3️⃣ Memantau level kunci di berbagai timeframe secara bersamaan
🚀 Perbaikan yang Akan Datang
Gulir horizontal akan memungkinkan:
• Analisis pola HTF historis
• Perbandingan struktur saat ini vs. masa lalu
• Identifikasi zona kunci pada timeframe lebih tinggi
📚 Contoh Praktis
• Ketika 1M = hijau & 1H = merah → Pasar sedang mengoreksi dalam tren bullish → Hanya short pada pantulan resistensi kunci
• Hierarki Tren: 1M > 1H > 4J > 1J → Selalu trading dengan arah lilin mingguan
• Entri Konfluensi:
- Harga di dukungan 1H + lilin hijau 4J yang muncul = peluang Long
- Resistensi di puncak 1J + lilin merah 4J = Short dengan stop di atas puncak
• Pola Breakout: - Jika lilin 1J menembus puncak sebelumnya sebelum penutupan (timer aktif), harapkan kelanjutan bullish
Ringkasan
Users can toggle individual higher timeframe candle blocks on or off and adjust the number of visible candles per timeframe (1 to 10). This facilitates monitoring of key levels and trend directions across multiple timeframes simultaneously. Practical use cases include anticipating candle closings, detecting live trend reversals, and identifying confluence entries based on support, resistance, and candle color changes.
Due to platform visual constraints, manual zoom and scroll are currently required for optimal viewing, especially on timeframes below 1 hour. Planned updates will introduce horizontal scrolling to enable historical pattern analysis, comparison of current versus past structures, and identification of key zones on higher timeframes.
HTF Candles supports traders in aligning trades with higher timeframe trends and enhances multi-timeframe market analysis within a single chart view.


![Logo "High-Low Divergence [Iridio Capital]"](https://cdn.ctrader.com/image/webp/443c4661-7abb-40f1-842f-4b6ec560649b_40914)


