
Penerangan
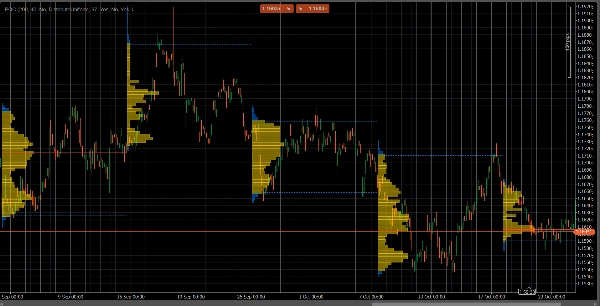
VolumeProfileSuite ialah penunjuk Volume Profile yang maju dan fleksibel untuk cTrader.
Tujuan utamanya adalah untuk menganalisis pengagihan volum (iaitu, di mana aktiviti perdagangan berlaku) pada tahap harga yang berbeza untuk mengenal pasti kawasan "nilai" (volum tinggi) dan "penolakan" (volum rendah). Ini membantu anda mencari tahap sokongan dan rintangan yang paling penting berdasarkan aktiviti pasaran sebenar.
Ciri uniknya ialah ia menggabungkan dua mod analisis yang berkuasa ke dalam satu alat, boleh dipilih melalui parameter Profile Mode:
FixedRangeMode: Sesuai untuk analisis makro. Ia membolehkan anda menganalisis satu blok besar pilihan anda (seperti 1000 bar terakhir atau julat tarikh tertentu, contohnya, "semua minggu lepas"). Ia sesuai untuk mencari tahap sokongan/rintangan utama jangka panjang.PeriodicMode: Sesuai untuk analisis mikro dan tingkah laku. Ia secara automatik melukis profil baru setiap "N" bar (contohnya, setiap 100 bar). Ini membolehkan anda melihat bagaimana POC dan Kawasan Nilai berkembang dari masa ke masa dan mengkaji corak berulang pasaran.- Panduan Parameter (Bahasa Inggeris)
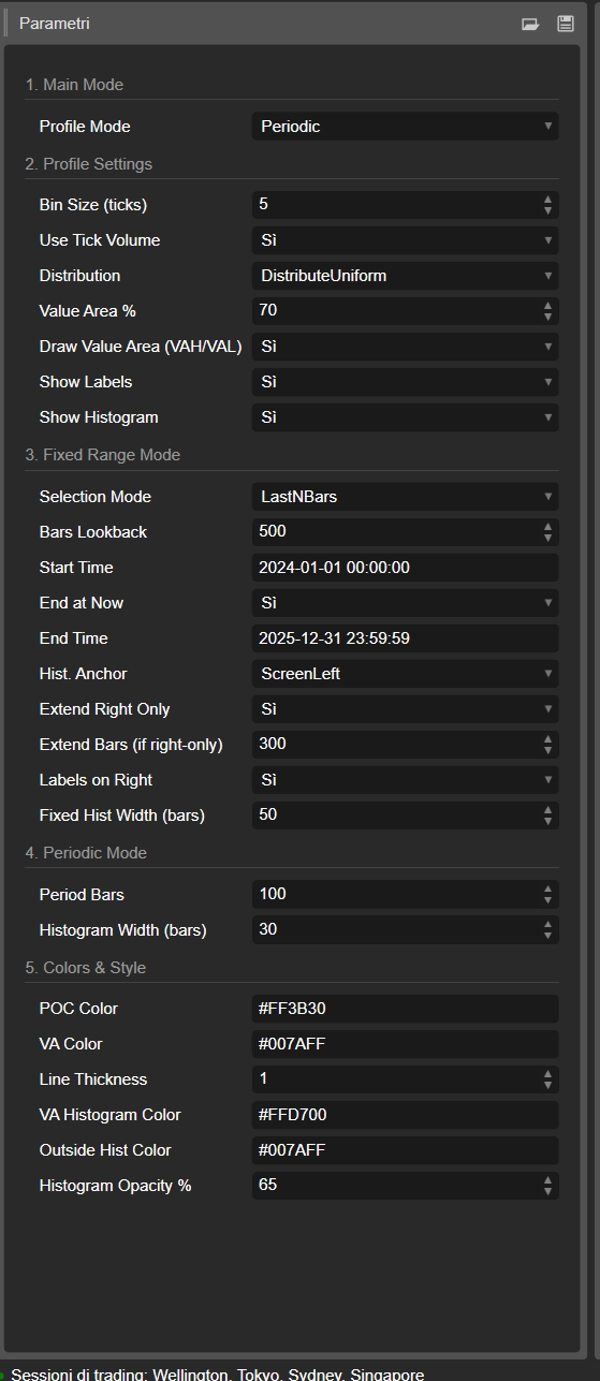
Berikut adalah panduan terkini untuk penunjuk VolumeProfileSuite anda yang baru dan bersatu. Panduan ini penting kerana ia menerangkan parameter mana yang perlu digunakan (dan mana yang perlu diabaikan) berdasarkan mod yang anda pilih.
Kumpulan 1: Mod Utama
- Profile Mode: Ini adalah parameter paling penting dan bertindak sebagai suis utama.
-
FixedRange: Mengaktifkan mod "blok tunggal". Penunjuk akan menganalisis hanya satu interval yang ditentukan oleh anda (menggunakan tetapan dalam Kumpulan 3).Periodic: Mengaktifkan mod "bersiklus". Penunjuk akan secara automatik menganalisis keseluruhan carta dalam blok (berdasarkan tetapan dalam Kumpulan 4).
PENTING: Apabila dalam mod
FixedRange, anda mesti mengabaikan semua parameter dalam "Kumpulan 4: Mod Periodik". Apabila dalam modPeriodic, anda mesti mengabaikan semua parameter dalam "Kumpulan 3: Mod Julat Tetap".
Kumpulan 2: Tetapan Profil
Parameter ini adalah biasa dan terpakai kepada kedua-dua mod (FixedRange dan Periodic).
- Saiz Bin (ticks): Mengawal "resolusi" menegak profil. Nilai rendah (contohnya,
1) menghasilkan banyak baris harga nipis (sangat terperinci). Nilai tinggi (contohnya,10) mengelompokkan harga ke dalam baris yang lebih tebal (kurang terperinci, "lebih licin"). - Gunakan Volum Tick: Jika
true(disyorkan), profil menggunakan volum tick sebenar, yang sangat tepat. Jikafalse, ia hanya mengira "1" untuk setiap bar. - Pengagihan: Menentukan bagaimana volum bar diagihkan.
-
DistributeUniform(lalai): "Menyebarkan" volum bar ke semua tahap harga yang disentuhnya, dari rendah ke tinggi.CloseOnly: Menetapkan semua volum bar hanya kepada harga penutupannya.
- Peratus Kawasan Nilai: Menetapkan peratusan volum yang membentuk "Kawasan Nilai" (kawasan aktiviti perdagangan tertinggi). Nilai
70(70%) adalah piawaian pasaran. - Lukis Kawasan Nilai (VAH/VAL): Jika
true, melukis garis mendatar untuk Nilai Kawasan Tinggi (VAH) dan Nilai Kawasan Rendah (VAL). - Tunjukkan Label: Jika
true, menunjukkan label teks ("POC", "VAH", "VAL"). (Berhati-hati: dalam modPeriodic, ini boleh memenuhi carta). - Tunjukkan Histogram: Jika
true, melukis histogram volum (bar mendatar).
Kumpulan 3: Mod Julat Tetap
⚠️ Gunakan parameter ini HANYA jika "Profile Mode" ditetapkan kepada FixedRange.
- Mod Pemilihan: Memilih bagaimana untuk mentakrifkan blok tunggal anda.
-
DateRange: Menggunakan tarikh/masa mula dan tamat tertentu.LastNBars: Menggunakan N bar terakhir.
- Bars Lookback: (Untuk
LastNBarssahaja) Berapa banyak bar untuk dianalisis ke belakang (contohnya,500). - Masa Mula / Tamat Sekarang / Masa Tamat: (Untuk
DateRangesahaja) Mentakrifkan permulaan dan penghujung interval anda. - Anchor Hist.: (Untuk
FixedRangesahaja) Mentakrifkan di mana histogram dipasang. -
DateRangeStart: Di permulaan interval anda (boleh di luar skrin).ScreenLeft: Ke tepi kiri tetingkap yang kelihatan.ScreenRight: Ke tepi kanan tetingkap yang kelihatan (di ruang kosong).
- Lebar Hist Tetap (bar): Lebar histogram (dalam bar) untuk mod
FixedRange. - Lanjutkan Hanya ke Kanan: Jika
true, garis POC/VAH/VAL dilanjutkan ke masa depan. - Lanjutkan Bar: (Hanya jika
Extend Right Onlyadalahtrue) Berapa banyak bar untuk melanjutkan garis. - Label di Kanan: Jika
true, meletakkan label harga di hujung kanan garis yang dilanjutkan.
Kumpulan 4: Mod Periodik
⚠️ Gunakan parameter ini HANYA jika "Profile Mode" ditetapkan kepada Periodic.
- Bar Tempoh: Ini adalah parameter utama untuk mod ini. Ia menentukan berapa banyak bar untuk dimasukkan dalam setiap blok bersiklus (contohnya,
100). - Maksimum Tempoh untuk Lukis: 🌟 PARAMETER KESELAMATAN! Ini mengehadkan bilangan profil bersiklus yang dilukis untuk mengelakkan cTrader daripada terhenti.
50bermaksud ia hanya akan melukis 50 profil terkini, walaupun sejarahnya lebih banyak. Jangan tetapkan terlalu tinggi (contohnya, > 200) atau cTrader mungkin beku! - Lebar Histogram (bar): Lebar histogram (dalam bar) untuk setiap blok bersiklus.
Kumpulan 5: Warna & Gaya
Parameter ini adalah biasa dan terpakai kepada kedua-dua mod.
- Warna POC: Warna garis Point of Control.
- Warna VA: Warna garis VAH dan VAL.
- Ketebalan Garis: Ketebalan garis POC, VAH, dan VAL.
- Warna Histogram VA: Warna bar histogram di dalam Kawasan Nilai (lalai: Kuning).
- Warna Histogram Luar: Warna bar histogram di luar Kawasan Nilai (lalai: Biru).
- Ketelusan Histogram %: Ketelusan (opacity) keseluruhan histogram.
Ringkasan
The indicator offers two primary modes selectable via the Profile Mode parameter:
1. FixedRange Mode: Enables macro-level analysis by focusing on a single user-defined interval, such as a specific date range or a set number of bars, to identify major long-term support and resistance levels.
2. Periodic Mode: Facilitates micro and behavioral analysis by automatically generating volume profiles for consecutive blocks of bars, allowing observation of how the Point of Control (POC) and Value Area evolve over time.
Common configurable settings include bin size (price resolution), volume distribution method (uniform or close-only), use of tick volume, value area percentage, and display options for value area lines, labels, and histograms. Each mode has dedicated parameters to define intervals, histogram placement, and extension of key levels.
Visual customization options cover colors and line thickness for POC, value area lines, and histogram bars. The tool supports analysis across various markets and symbols, including Forex, indices, commodities, and cryptocurrencies.