Açıklama
Akıllı Mum Bazlı Delta Hesaplaması ile Profesyonel Hacim Analizi
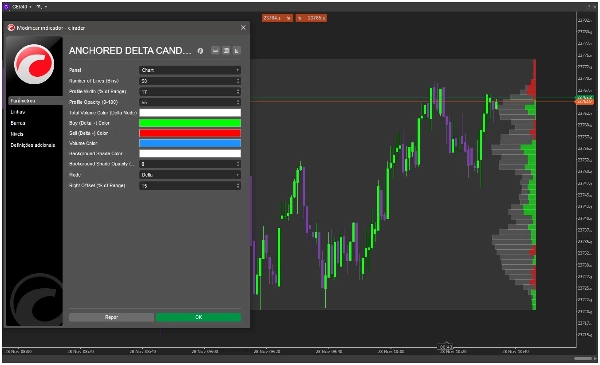
Kurumsal düzeyde hacim analizinin gücünü açığa çıkarın ANCHORED DELTA CANDLE VOLUME PROFILE ile, cTrader için en gelişmiş ankrajlı hacim profili göstergesi. Kesin piyasa içgörüsü talep eden ciddi tüccarlar için tasarlanmış bu gösterge, akıllı mum bazlı delta hesaplamasıyla gerçek piyasa aktivitesinin nerede gerçekleştiğini ortaya koyar.
🎯 TEMEL ÖZELLİKLER
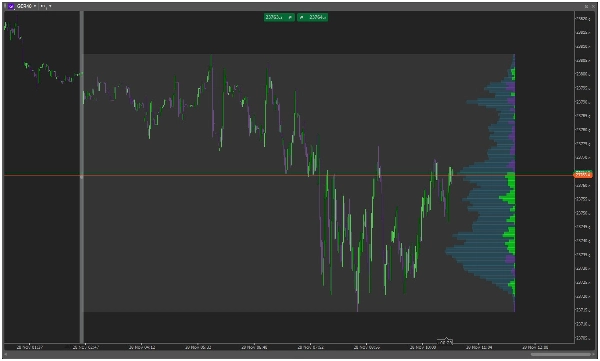
🏓 AKILLI ANKRAJ SİSTEMİ
- Grafiğinizde istediğiniz yere dikey bir çizgi çizin
- Seçtiğiniz noktaya ankrajlı otomatik profil oluşturma
- Yeni fiyat hareketleri geliştikçe dinamik güncellemeler
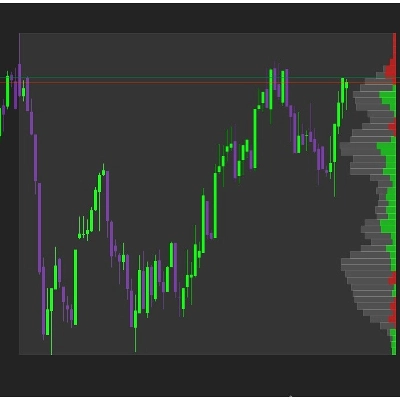
📊 AKILLI MUM BAZLI DELTA
- Mum yönüne dayalı gelişmiş delta analizi
- Yeşil mumlar = Alım Hacmi | Kırmızı mumlar = Satım Hacmi
- Fiyat seviyesine göre temiz, tek renkli görselleştirme
- Alım/satım baskısı bölgelerinin anında tespiti
🎨 ÖZELLEŞTİRİLEBİLİR GÖRSEL TASARIM
- Ayarlanabilir profil genişliği (aralığın %5-100'ü)
- Alım/satım/toplam hacim için özelleştirilebilir renkler
- Mükemmel grafik entegrasyonu için şeffaflık kontrolleri
- Gelişmiş okunabilirlik için profesyonel gölgelendirme
⚡ ESNEK GÖSTERİM MODLARI
- Delta Modu: Her fiyat seviyesinde net alım/satım baskısını görün
- Hacim Modu: Geleneksel hacim profili gösterimi
- Optimum grafik alanı kullanımı için sağa ankrajlı
🚀 NEDEN TİCARET YAPANLAR SEVİYOR
"Sonunda, gerçekten işe yarayan bir hacim profili! Mum bazlı delta hesaplaması kurumsal aktiviteyi tespit etmekte inanılmaz derecede doğru." - Profesyonel Tüccar
"Piyasa profili analizimde oyunun kurallarını değiştirdi. Ankraj sistemi mükemmel ve mum bazlı yaklaşım çok mantıklı." - Kurumsal Analist
📈 MÜKEMMEL KULLANIM ALANLARI
- Piyasa Profili Tüccarları - Değer alanlarını ve zayıf yüksek/düşükleri belirleyin
- Açık Artırma Piyasa Teorisyenleri - Piyasa gelişim süreçlerini anlayın
- Hacim Bazlı Stratejiler - Hacim doğrulaması ile kırılmaları onaylayın
- Kurumsal Akış Analizi - Akıllı para birikimi/dağıtımını tespit edin
🛠 KULLANIMI KOLAY
- Çizin ankraj noktanıza dikey bir çizgi
- İzleyin ANCHORED DELTA CANDLE VOLUME PROFILE otomatik olarak oluşturulurken
- Analiz Edin fiyat seviyeleri arasındaki delta dağılımını
- Ticaret Yapın hacimle doğrulanmış seviyeleri kullanarak güvenle
🔧 TEKNİK ÖZELLİKLER
- Gerçek zamanlı hesaplama
- Düşük kaynak tüketimi
- Tüm zaman dilimleri ile uyumlu
- Tüm enstrümanlarla çalışır (Forex, Hisse Senetleri, Kripto, Vadeli İşlemler)
📋 DAHİLİ PARAMETRELER
- Çizgi/Kutu Sayısı (5-100)
- Profil Genişliği Yüzdesi
- Opaklık Kontrolleri
- Özel Renk Şemaları
- Sağa Ofset Ayarı
- Gösterim Modu (Delta/Hacim)
🎯 BUGÜN GRAFİK ANALİZİNİZİ DÖNÜŞTÜRÜN!
Piyasa analizlerini ANCHORED DELTA CANDLE VOLUME PROFILE ile geliştiren binlerce profesyonel tüccara katılın. Tahmin etmeyi bırakın ve kesin mum bazlı delta hesaplamasıyla gerçek piyasa aktivitesinin nerede olduğunu görmeye başlayın.
⭐ "Bu gösterge hacim analizine getirdiği netlik eşsiz. Mum bazlı delta yaklaşımı tam bir deha."
ANCHORED DELTA CANDLE VOLUME PROFILE'ı bugün cTrader platformunuza ekleyin ve kurumsal düzeyde içgörü ile ticaret yapın!


