Açıklama
🚀 Grafiğinizi Stratejik Bir Karar Merkezine Dönüştürün
Smart Tech Analysis sadece bir gösterge değildir.
Karar alma sürecinde netlik, hassasiyet ve çeviklik isteyen tüccarlar için geliştirilmiş tam donanımlı bir akıllı analiz panelidir.
Çoğu gösterge yalnızca izole bilgi sunarken, Smart Tech Analysis şunları entegre eder:
✔ Trend
✔ Hacim
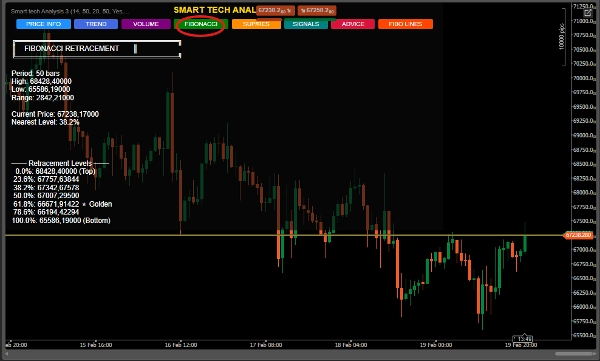
✔ Fibonacci
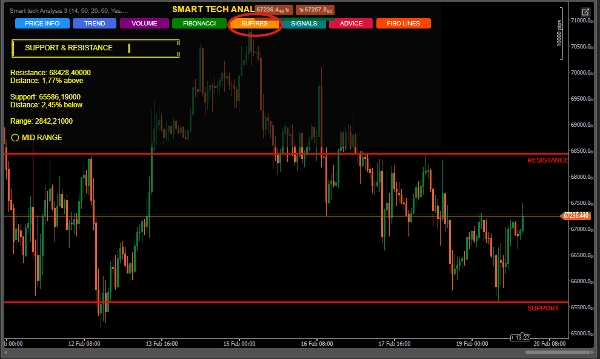
✔ Destek ve Direnç
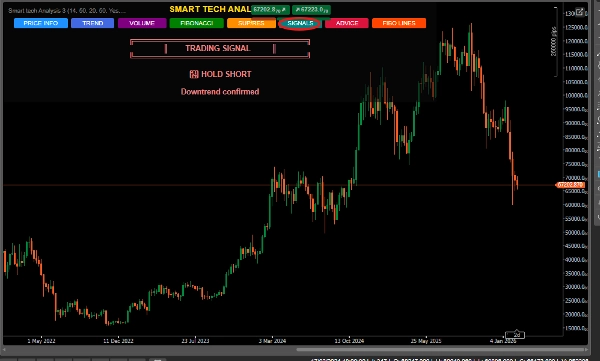
✔ Teknik Sinyaller
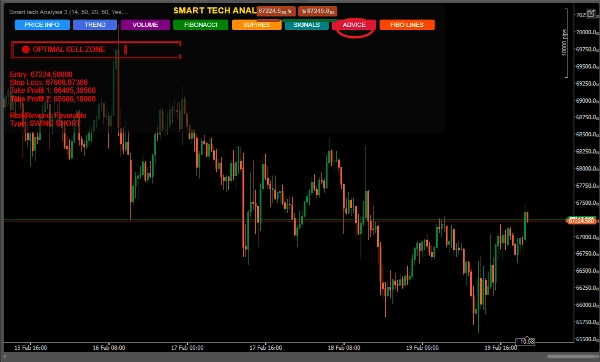
✔ Operasyonel Öneriler
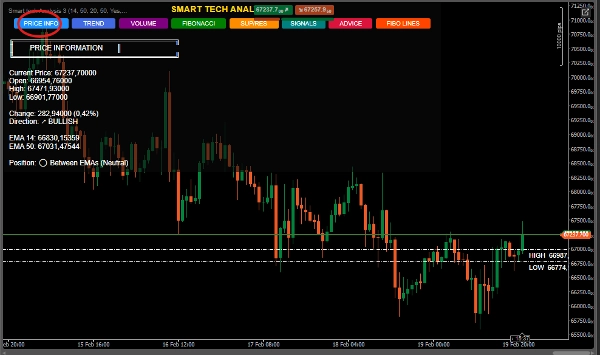
✔ Detaylı Fiyat Bilgisi
Hepsi tek bir dinamik ve etkileşimli panelde.
🔥 BÜYÜK FARK
🎯 1. 6’sı 1 Arada Sistem – Entegre Analiz
Artık birden fazla gösterge arasında geçiş yapmanıza gerek yok.
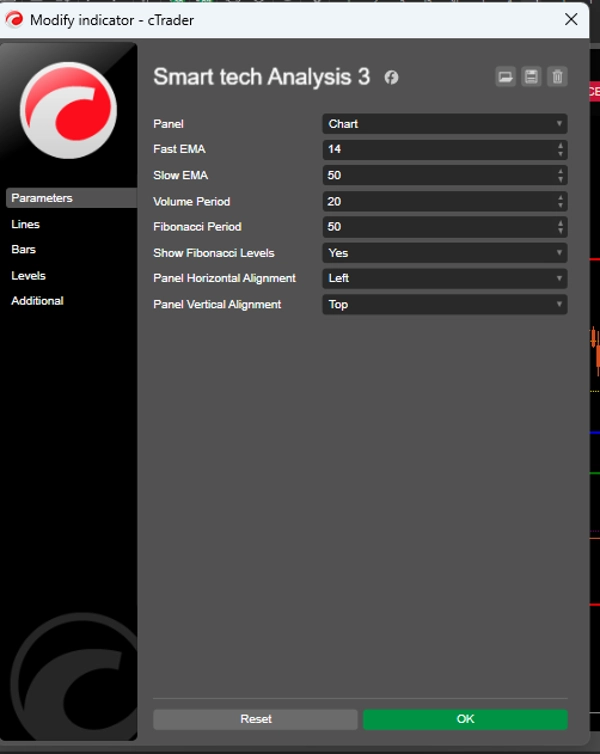
Smart Tech Analysis şunları birleştirir:
📈 Hızlı ve yavaş EMA’lar (14 ve 50)
📊 Karşılaştırmalı analizle hacim
🧩 Otomatik Fibonacci
🛡 Dinamik destek ve direnç
🚦 Akıllı sinyal üretimi
📌 Hesaplanmış stop ve hedeflerle öneriler
👉 Bu, görsel karmaşayı azaltır ve nesnelliği artırır.
🧠 2. Özel Etkileşimli Panel
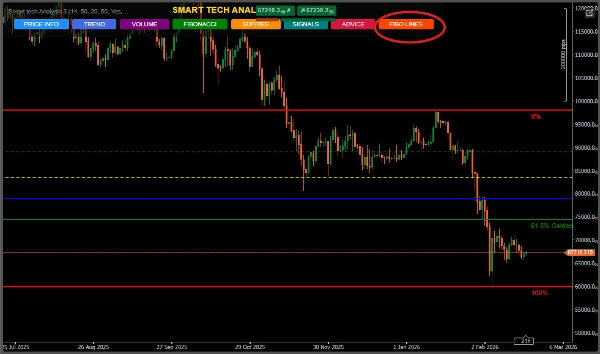
Akıllı butonlarla profesyonel arayüz:
FİYAT BİLGİSİ
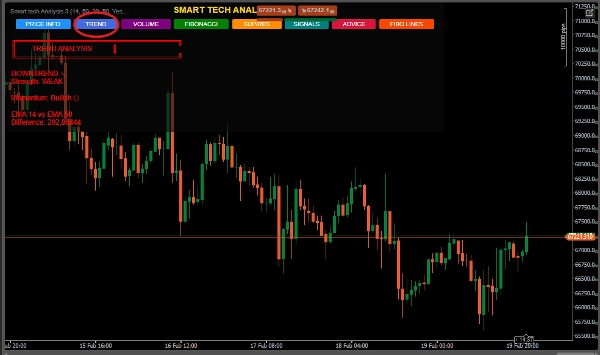
TREND
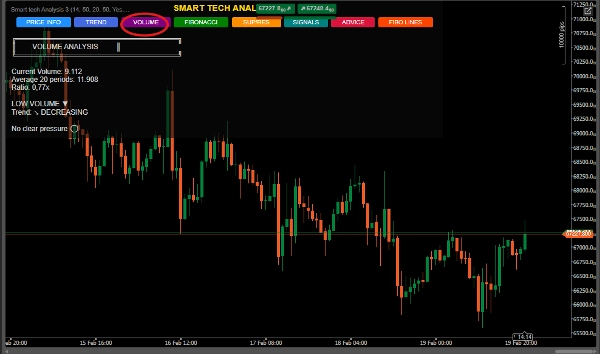
HACİM
FİBONACCİ
DESTEK/DRNÇ
SİNYALLER
ÖNERİLER
Tüccar tam olarak ne görmek istediğini seçer.
📌 Organizasyon.
📌 Kontrol.
📌 Profesyonellik.
📈 3. Güç ve Momentum ile Trend Analizi
Sadece yukarı mı aşağı mı gidiyor göstermez.
Şunları hesaplar:
Trend yoğunluğu
EMA’lar arasındaki yüzde gücü
Sınıflandırma: Zayıf, Orta veya Güçlü
Bu, yatay piyasalarda zayıf girişleri önler.
📊 4. Kurumsal Okuma ile Hacim
Sistem şunları tanımlar:
Aşırı hacim
Alım veya satım baskısı
Hızlanma veya yavaşlama
Tarihsel ortalama ile karşılaştırma
👉 Olası kurumsal faaliyetleri tespit etmek için idealdir.
🧩 5. Altın Bölge ile Otomatik Fibonacci
Tanımlı dönem üzerinde dinamik olarak hesaplanır.
Özel vurgu:
⭐ %61.8 Bölgesi (Altın Bölge)
📌 En yakın seviyenin tanımlanması
📌 Boğa ve ayı uzantıları
📌 Otomatik bağlamsal öneri
Geri çekilme ve salınım tüccarları için mükemmeldir.
🛡 6. Akıllı Destek & Direnç
İlgili yüksek ve düşükleri tespit eder
Mevcut fiyattan yüzde uzaklığı gösterir
Pozisyonu sınıflandırır: Destek yakınında, dirençte veya orta aralıkta
Grafikte otomatik çizgiler çizer
Stratejik bölgelere giriş için idealdir.
🚦 7. Uyumluluk Sinyal Sistemi
Algoritma rastgele sinyaller üretmez.
Şunları birleştirir:
✔ EMA kesişimi
✔ Destek/direnç yakınlığı
✔ Trend yapısı
✔ Fiyat bağlamı
Sınıflandırma:
🟢 GÜÇLÜ AL
🔴 GÜÇLÜ SAT
📈 UZUN TUT
📉 KISA TUT
⏸ BEKLE
Belirtilen güven seviyesi ile.
🎯 8. Risk Yönetimi ile Öneriler
"ÖNERİLER" paneli şunları sunar:
Önerilen giriş
Teknik Stop Loss
İki Kar Al hedefi
Salınım yapısı (Uzun veya Kısa)
Operasyon bağlamı
👉 Sadece analiz değil.
👉 Yapılandırılmış bir plan.
🏆 Bu gösterge kimler için?
✔ Netlik arayan yeni başlayan tüccarlar
✔ Uyumluluk isteyen orta seviye tüccarlar
✔ Verimlilik arayan ileri seviye tüccarlar
✔ Salınım tüccarları
✔ Yapısal onay kullanan scalperlar
💎 Piyasada neden öne çıkıyor? Yaygın Göstergeler Smart Tech Analysis
İzole Bilgi Entegre Analiz Görsel Kirlilik Düzenli Panel Bağlam Yok Teknik Uyumluluk Yok Yönetim Önerilen Stop ve Hedef Basit Sinyaller Onaylı Sinyaller
📊 Doğrudan Faydalar
✔ Duygusal kararları azaltır
✔ Doğruluğu artırır
✔ Yapısal okumayı geliştirir
✔ Zaman kazandırır
✔ Tüccarın profesyonel standartlarını yükseltir
🧠 Piyasa Konumlandırması
Smart Tech Analysis için idealdir:
Forex Piyasası
Endeksler
Emtialar
Kripto Paralar


!["[Hamster-Coder] Bollinger Bands" logosu](https://cdn.ctrader.com/image/webp/21d8e5d6-fb11-4bac-b9ee-cd05c2b76804_30327)


