Penerangan
Data pasaran apa yang dianalisis
London Open Signal memuat sejarah intrahari simbol yang dilampirkan selama bertahun-tahun terus dari broker anda (resolusi M15 atau H1, pilihan anda) dan menyusun semula setiap hari dagangan lalu ke dalam dua tetingkap: julat "hari" penuh (jam mula/akhir yang boleh dikonfigurasikan) dan sesi London itu sendiri (jam buka/tutup yang boleh dikonfigurasikan, dalam masa pelayan broker). Untuk setiap sesi sejarah ia mensimulasikan dua dagangan hipotesis — panjang dan pendek — menggunakan stop dan sasaran tetap, keluar pada penutupan sesi jika tiada yang tercapai, bersih dari elaun untuk spread dan kos. Ia kemudian menguji lima idea mudah terhadap hasil tersebut untuk melihat yang mana, jika ada, sebenarnya meramalkan keputusan: rentetan menang/kalah semalaman semasa, hari dalam minggu, di mana harga pembukaan sesi berada dalam julat hari sebelumnya, jurang berbanding penutupan hari sebelumnya, dan sama ada julat hari sebelumnya luar biasa luas atau sempit.
Cara mentafsir isyarat dan elemen visual
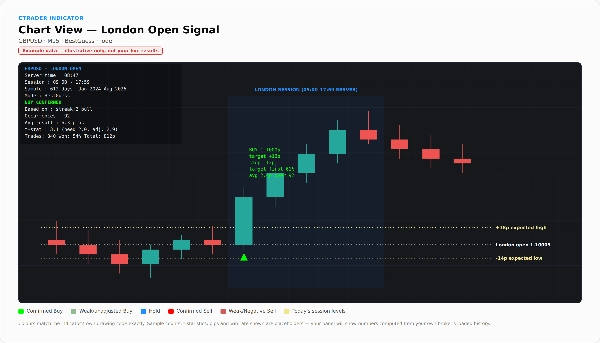
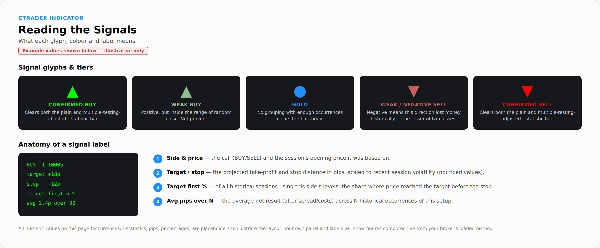
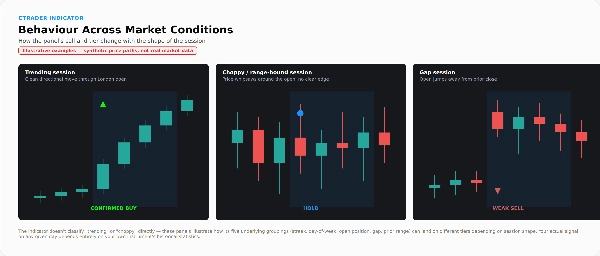
Anak panah hijau ke atas menandakan panggilan Beli pada pembukaan London hari itu; anak panah merah ke bawah menandakan Jual; titik biru menandakan Pegang (tiada kelebihan yang boleh dipertahankan ditemui). Anak panah sejarah ini dikira secara berjalan ke hadapan — setiap satu hanya menggunakan data yang tersedia sebelum hari itu, tidak pernah hasil hari itu sendiri.
Panel pada carta (kiri atas) menunjukkan panggilan hari ini dan label tahap: DISEMAK, DISEMAK (tidak disesuaikan), LEMAH, atau NEGATIF. Ini memberitahu anda sejauh mana untuk mempercayai anak panah itu — LEMAH bermakna kelebihan yang kelihatan berada dalam julat bunyi rawak, dan NEGATIF bermakna arah itu sebenarnya telah kehilangan wang secara sejarah dan anak panah itu hanya yang kurang buruk daripada dua kerugian. Panel juga menunjukkan kumpulan yang menjadi asas panggilan, berapa kali ia berlaku, hasil purata, statistik t terhadap kedua-dua ambang biasa dan yang disesuaikan untuk ujian berganda, dan — yang paling penting — papan skor berjalan ke hadapan: berapa banyak dagangan yang alat ini sebenarnya akan ambil, kadar kemenangan, jumlah pips, pips setiap dagangan, dan penurunan terburuk. Jika jumlah berjalan itu rata atau negatif, panel akan menyatakannya secara langsung.
Tiga lapisan pilihan menambah butiran: jadual keputusan penuh (setiap kumpulan diuji, dengan saiz sampel dan statistik t untuk kedua-dua arah), "makmal stop/sasaran" yang menunjukkan bagaimana kadar kemenangan berubah hanya dari tempat anda meletakkan stop dan sasaran — untuk menunjukkan bahawa kadar kemenangan tinggi bukan sama dengan kelebihan sebenar — dan kotak tahap sesi yang menunjukkan saiz tipikal pergerakan naik, turun, dan julat keseluruhan sesi London pada median/75th/90th peratusan. Garis putus-putus pada sesi hari ini menandakan pembukaan dan jangkaan tinggi/rendah yang diskalakan oleh volatiliti.
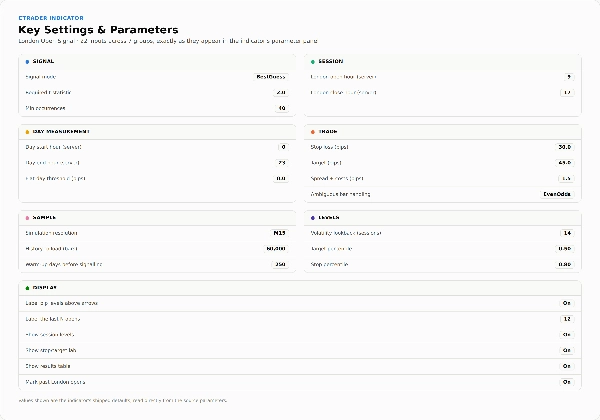
Tetapan dan parameter utama
- Isyarat: Mod (Hanya Disahkan vs Anggaran Terbaik), Statistik t yang diperlukan, Minimum kejadian sebelum kumpulan dikira
- Sesi: Jam buka London, jam tutup London (masa pelayan broker)
- Pengukuran hari: Jam mula/akhir hari, ambang hari rata (pips)
- Dagangan: Stop loss (pips), Sasaran (pips), Elaun spread/kos (pips), Pengendalian bar samar (Pesimis / Peluang sama / Optimis, untuk bar yang menyentuh kedua-dua stop dan sasaran)
- Sampel: Resolusi simulasi (H1/M15), Sejarah untuk dimuat (bar), Hari pemanasan sebelum alat mula memberi isyarat
- Tahap: Lihat kembali volatiliti (sesi), Peratusan sasaran, Peratusan stop
- Paparan: Label anak panah / kiraan label, tunjuk tahap sesi, tunjuk makmal stop-sasaran, tunjuk jadual keputusan, tandakan pembukaan London lalu
Kes penggunaan tipikal dan senario dagangan
Memeriksa panel sebelum pembukaan London untuk panggilan semasa, tahapnya, dan julat sesi yang dijangka untuk hari itu. Menyelidik sama ada sebarang corak mudah dan boleh ditafsirkan telah bertahan secara statistik untuk pasangan tertentu sepanjang sejarahnya sendiri — dan melihat dengan jujur sama ada corak itu bertahan selepas pembetulan untuk menguji beberapa idea sekaligus. Menggunakan unjuran tahap sesi (tinggi/rendah yang dijangka) untuk merancang sasaran atau stop secara bebas daripada panggilan beli/jual itu sendiri. Ia tidak direka untuk pelaksanaan automatik tanpa pengawasan — ia adalah penunjuk, bukan cBot, dan tidak pernah meletakkan dagangan sendiri.
Siapa yang paling sesuai menggunakannya
Pedagang yang ingin melihat rekod prestasi sebenar yang disahkan berjalan ke hadapan di sebalik isyarat dan bukannya menerima tuntutan secara membuta tuli, dan yang selesa membaca statistik t dan nombor penurunan bersama anak panah. Pedagang sesi London secara budi bicara yang menghargai konteks julat sesi walaupun mereka memilih untuk mengabaikan panggilan beli/jual. Ia sengaja tidak dibina untuk seseorang yang mencari sistem "ikuti anak panah sahaja" plug-and-play — alat ini menilai isyaratnya sendiri dan akan memberitahu anda terus apabila nombor tidak menyokong dagangan mereka.
Had dan nota penggunaan penting
- Prestasi dikira secara langsung dari sejarah broker yang sebenarnya dimuatkan apabila penunjuk berjalan — ia bukan fail backtest pra-jana tetap, jadi keputusan boleh berbeza mengikut broker/akaun dan memerlukan sejarah yang cukup dimuat (tingkatkan "Sejarah untuk dimuat" jika panel melaporkan data tidak mencukupi).
- Penyesuaian ujian berganda adalah heuristik, bukan jaminan — ambang yang disesuaikan mengurangkan, tetapi tidak menghapuskan, kemungkinan hasil kelihatan bermakna hanya kerana nasib.
- Lima idea yang diuji adalah pengelasan faktor tunggal yang mudah, diperiksa secara bebas dan bukan digabungkan — pilihan sengaja untuk memastikan alat boleh ditafsir dan mengelakkan risiko overfitting bertambah.
- Dalam mod Anggaran Terbaik penunjuk sentiasa menunjukkan arah, termasuk panggilan tahap NEGATIF — sentiasa baca label tahap, bukan hanya anak panah.
- Isian stop/sasaran simulasi menggunakan andaian yang dipermudahkan untuk bar yang menyentuh kedua-dua tahap dalam lilin yang sama; pelaksanaan sebenar mungkin berbeza.
- Berdasarkan harga/statistik semata-mata — tiada input berita, fundamental, atau rentas aset.
- Hanya visual dan analitik; ia tidak meletakkan dagangan.
Ringkasan
The indicator tests five simple, independent factors—overnight streak, day of the week, opening price position within the previous day’s range, gap size, and previous day’s range width—to identify statistically significant edges. Signals are displayed as arrows on the chart: green for Buy, red for Sell, and blue for Hold, with a tier label (CONFIRMED, WEAK, NEGATIVE) indicating the confidence level based on walk-forward testing.
A panel shows detailed statistics including win rate, total pips, t-statistics, and drawdown, updated live from broker data. Optional overlays provide a full results table, stop/target sensitivity analysis, and session-level range projections. The tool is purely analytical and visual; it does not execute trades and is intended for traders comfortable interpreting statistical metrics alongside signals.