Açıklama
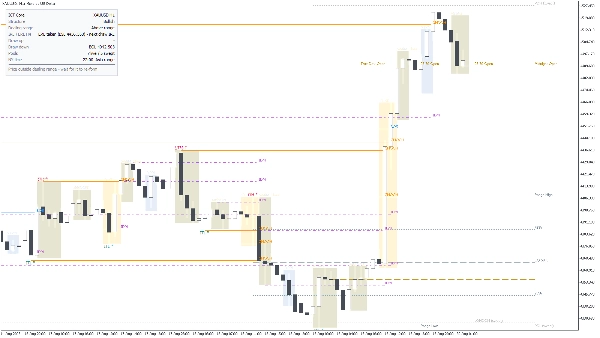
ICT Core, ham bir fiyat grafiğini yapılandırılmış Akıllı Para Kavramları (ICT) okumasına dönüştürür: piyasa yapısı, likidite havuzları, işlem aralığı, IRL / ERL durumu, New York seansları ve killzone'lar, ayrıca mevcut eğilimi ve koşullu planı sade İngilizce ile belirten bir panel. Sadece kapanmış, onaylanmış fiyat hareketlerinden çizim yapar - bir seviye veya etiket yazdırıldıktan sonra olduğu yerde kalır.
NEYİ ANALİZ EDER
ICT Core, grafik sembolünden bar verilerini (açılış / yüksek / düşük / kapanış) ve IRL / ERL okuması için seçtiğiniz bir üst zaman dilimini (varsayılan H4) okur. ATR, salınım büyüklüğünü, etiket aralığını ve eşit-yüksek / eşit-düşük toleransını ölçeklendirmek için kullanılır, böylece aynı ayarlar XAUUSD, endeksler ve FX üzerinde tutarlı davranır. Seans ve killzone zamanlaması, sabit broker saatlerinde değil, otomatik DST işlemesi ile New York saatine göre hesaplanır.
NE ÇİZER VE NASIL OKUNUR
- Piyasa yapısı. Salınımlar kısa vadeli, orta vadeli ve uzun vadeli olarak sınıflandırılır. Kırılmalar BOS (devam) veya CHOCH (karakter değişimi) olarak etiketlenir; sadece fitil tarafından yapılan kırılma ayrı olarak süpürme olarak işaretlenir, böylece gerçek yer değiştirme ile baskını ayırt edebilirsiniz. İmpulsif bir bacak tarafından alınan yüksekler ve düşükler güçlü / zayıf olarak etiketlenir.
- İndüksiyon (IDM). Fiyatın gerçek hareketten önce koşması muhtemel küçük yüksek veya düşük işaretlenir, böylece tuzak tetiklenmeden önce görülebilir.
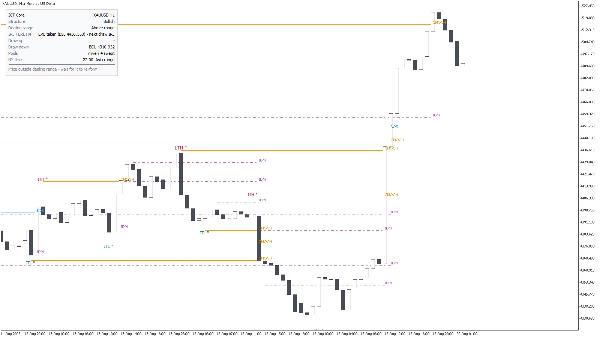
- Likidite havuzları. Önceki gün, önceki hafta, önceki ay, seans yüksekleri ve düşükleri ile eşit yüksekler / eşit düşükler alım tarafı (BSL) ve satım tarafı (SSL) seviyeleri olarak çizilir. Bir havuz süpürüldüğünde silinmez, soluklaştırılır, böylece alınan geçmiş okunabilir kalır.
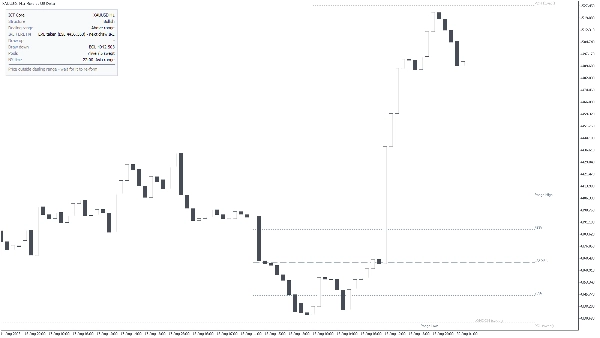
- İşlem aralığı. Son geçerli yüksek ve düşük arasındaki aktif aralık, opsiyonel olarak premium / indirim referansı için %25 / %75 çeyrek dilimleri ile.
- IRL / ERL. Panel, dış likiditenin alınıp alınmadığını ve bir sonraki çizimin içsel mi yoksa dışsal mı olduğunu, seçtiğiniz üst zaman diliminden okur.
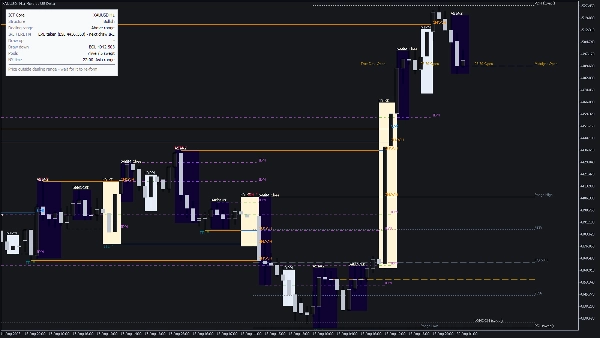
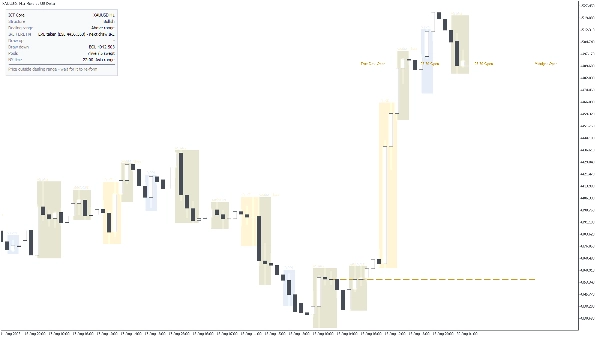
- Seanslar ve zaman. Asya, Londra, NY AM ve NY PM kutuları; Londra, New York ve Londra-kapanış killzone'ları; gümüş kurşun pencereleri; opsiyonel 20 dakikalık makrolar; ve seans açılış fiyat çizgileri.
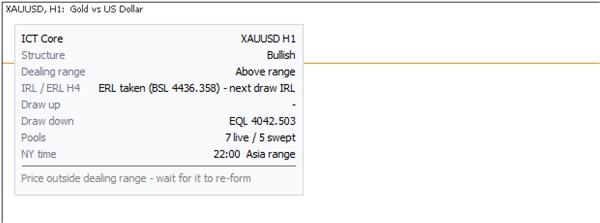
- Bilgi paneli. Sembol ve zaman dilimi, yapı eğilimi, fiyatın işlem aralığındaki konumu, IRL / ERL durumu, üstte ve altta en yakın çizim ve fiyatı, kaç havuzun aktif veya süpürülmüş olduğu, New York saati ve aktif seans - ayrıca "Fiyat işlem aralığının dışında - yeniden oluşmasını bekleyin" gibi koşullu plan satırı.
- Uyarılar. Havuz süpürme, BOS / CHOCH ve killzone açılışında açılır pencere, ses veya e-posta.
ANA AYARLAR
- Genel: grafik teması (otomatik / açık / koyu), analiz edilecek bar sayısı (varsayılan 1500), etiket yazı tipi boyutu ve etiketlerin ATR cinsinden ne kadar aralıkla yerleştirileceği.
- Piyasa yapısı: her iki tarafta bar cinsinden salınım gücü (varsayılan 2), hangi salınım katmanlarının gösterileceği, BOS / CHOCH açık veya kapalı, sadece fitil kırılmaları açık veya kapalı, indüksiyon açık veya kapalı ve yüksek veya düşük olarak güçlü sayılacak ATR cinsinden impuls büyüklüğü (varsayılan 1.0).
- Likidite havuzları: hangi havuzların çizileceği, ATR cinsinden eşit yüksek / düşük toleransı (varsayılan 0.15), bir havuzun süresi ne kadar (varsayılan 20), ve süpürülmüş havuzların görünür kalıp kalmayacağı.
- İşlem aralığı: aralık açık veya kapalı, %25 / %75 çeyrek dilimleri açık veya kapalı.
- IRL / ERL: kaynak zaman dilimi (varsayılan H4) ve kaç bar taranacağı (varsayılan 300).
- Seanslar: seans kutuları, killzone'lar, gümüş kurşun, makrolar, açılış fiyatları, geriye kaç gün çizileceği (varsayılan 5) ve kutu dolgu opaklığı.
- Panel: köşe, X / Y ofseti, yazı tipi boyutu, plan satırının gösterilip gösterilmeyeceği, bir süpürmenin hala yakın sayılacağı bar sayısı (varsayılan 12) ve planın aktif bir killzone gerektirip gerektirmediği.
- Uyarılar ve grafik üzerindeki her öğe için tam renk seti.
TIPİK KULLANIM
1. ICT Core'u XAUUSD, bir endeks veya büyük bir FX paritesinin M5 - H1 grafiğine ekleyin.
2. Paneli yukarıdan aşağıya okuyun: eğilim, işlem aralığındaki konum, IRL / ERL ve üstte ve altta en yakın çizim.
3. Bir likidite havuzu bir killzone içinde süpürülene kadar bekleyin, sonra giriş zaman diliminizde süpürmeye karşı CHOCH arayın.
4. Panelde gösterilen zıt çizimi hedef olarak kullanın ve süpürülmüş uç noktayı geçersiz kılma olarak alın.
5. Tüm seans boyunca grafiği izlemek istemiyorsanız süpürme ve BOS / CHOCH uyarılarını açın.
KİMLER İÇİN
Zaten ICT / Akıllı Para Kavramları ile çalışan ve yapıyı, likiditeyi ve zamanlama katmanlarını her gün elle çizmek yerine tek bir grafikte görmek isteyen traderlar için. Gün içi ve kısa salınım taktik traderlarına yöneliktir. Başlangıç seviyesinde al / sat ok aracı değildir - kullanmak için BOS, CHOCH, IDM, IRL ve ERL'nin ne anlama geldiğini bilmeniz gerekir.
ÖNEMLİ SINIRLAMALAR VE KULLANIM NOTLARI
- ICT Core bir analiz ve görselleştirme aracıdır. Emir vermez, al / sat sinyalleri vermez ve plan satırı bir öneri değil koşullu bir hatırlatmadır.
- Her şey onaylanmış salınımlardan türetilir, bu yüzden bir yapı noktası sadece her iki tarafta gerekli bar sayısı kapandıktan sonra (varsayılan 2) görünür. Sonrasında yeniden çizim yapılmaz.
- Seans ve killzone saatleri New York saatine ve DST'ye uygundur. Grafiğiniz broker sunucu saatinde gösterilir, bu yüzden kutular sabit UTC ofseti ile hizalanmaz - bu kasıtlıdır.
- Üst zaman dilimi IRL / ERL okuması, o zaman diliminde yeterli geçmişe ihtiyaç duyar; kısa geçmişi olan sembollerde kullanılamaz olarak gösterilir.
- Analiz, analiz edilecek barlar penceresi ile sınırlıdır (varsayılan 1500). Daha fazla geçmiş için artırabilirsiniz, ancak ilk çizim daha ağır olur.
- Windows ve Mac için cTrader Desktop'ta çalışır. Özel göstergeler mobil veya webde mevcut değildir.
- Ticaret risk içerir. Herhangi bir desenin geçmiş davranışı gelecekteki sonuçları garanti etmez. Her zaman kendi risk yönetiminizi kullanın.
Özet
ICT Core highlights liquidity pools from previous days, weeks, months, and sessions, showing buy-side and sell-side levels, and dims swept pools to maintain historical context. It also delineates session times and killzones based on New York time with automatic daylight saving adjustments. An info panel provides a summary of current bias, price position within the dealing range, IRL/ERL status, nearest levels, live versus swept pools, and a conditional trading plan in plain English.
Users can customize settings including chart theme, swing parameters, liquidity pool visibility, session displays, and alert notifications for pool sweeps, BOS/CHOCH events, and killzone openings. ICT Core is intended for traders familiar with ICT/SMC concepts seeking an integrated, structured view of market dynamics for intraday and short-swing discretionary trading.