Açıklama
Gösterge Genel Bakış
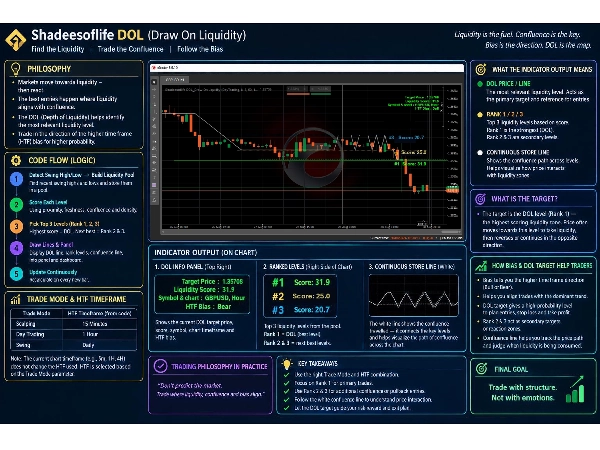
Shadeesoflife DOL (Likidite Üzerine Çizim) cTrader göstergesi, Akıllı Para Kavramları (SMC) ve ICT prensiplerine dayalı dinamik bir hedef tanımlama motoru sunar. Otomatik olarak Likidite Üzerine Çizgi (DOL) çizer, sıralar ve her tikte piyasadaki yapısal likidite havuzlarını - "Yüksek örtüşme"yi takip eder. DOL, dinamik bir hedef, yüksek örtüşmeli likiditedir.
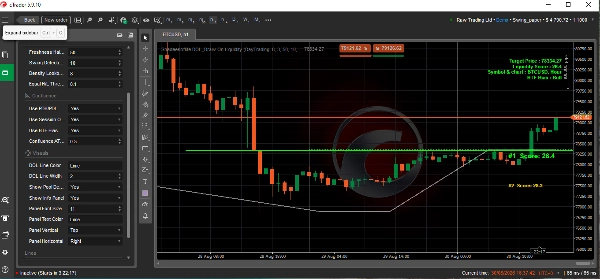
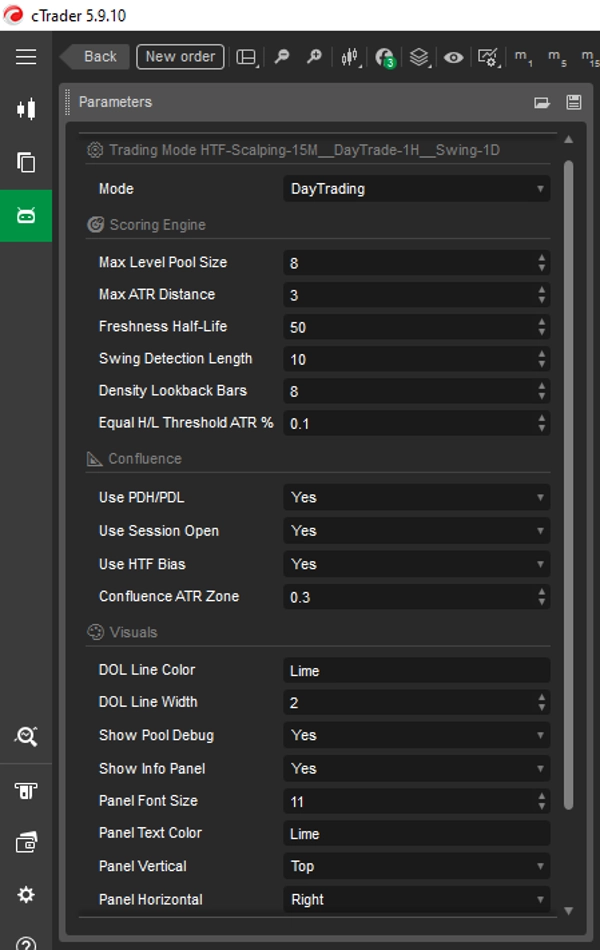
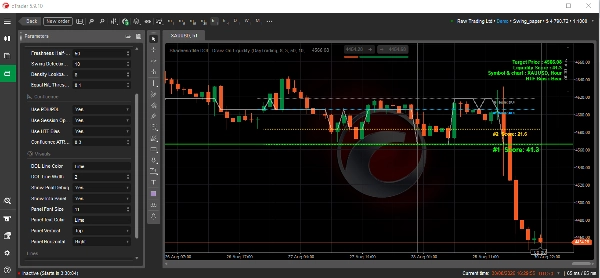
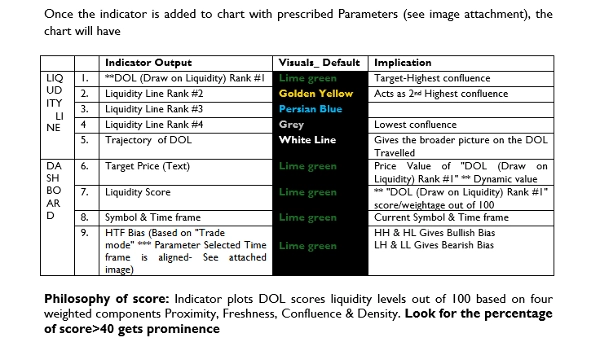
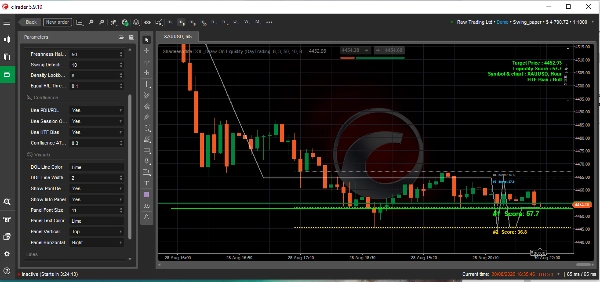
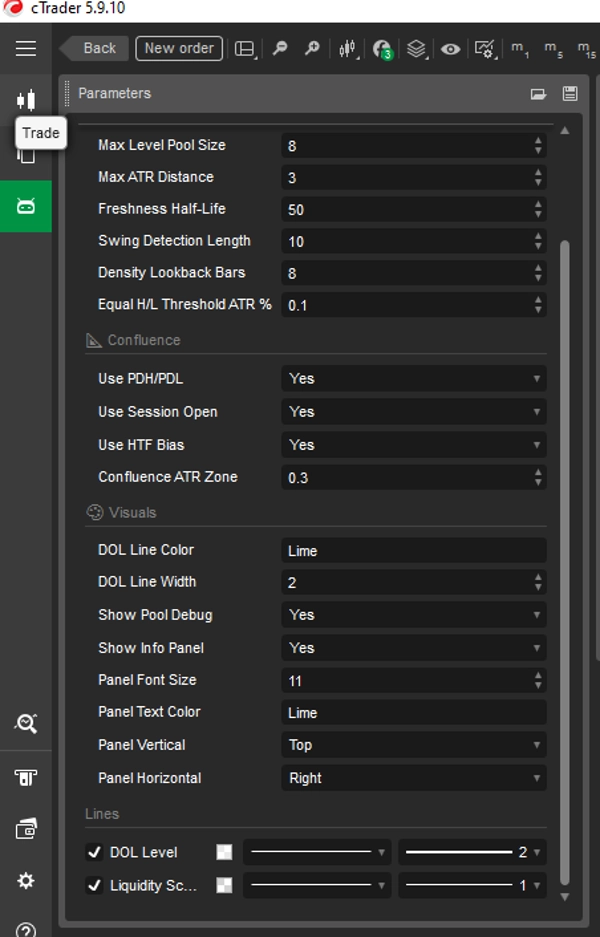
Gösterge, birincil DOL Hedefini (en yüksek puanlı seviye, belirgin bir çizgi olarak gösterilir) ve sıralanmış ikincil likidite hedefleri havuzunu verirken, mevcut HTF eğilimi ve hedef metriklerini gösteren ekranda bir panel sağlar. Gösterge, belirtilen Parametrelerle (bkz. ekli resim) grafik üzerine eklendiğinde, grafik şunları içerecektir
Cevap için - Ekli resme bakınız (Tablo).
Puan Felsefesi: Gösterge, DOL puanlarını dört ağırlıklı bileşene göre 100 üzerinden likidite seviyelerini çizer: Yakınlık, Tazelik, Örtüşme ve Yoğunluk.
SSS
1.Nasıl çalışır - HTF & LTF Çok Zaman Dilimli Strateji Çerçevesi??
Yüksek Zaman Dilimi (HTF) Eğilimi ve Yönünün Belirlenmesi
Gösterge, yapısal eğilimi belirlemek için temel Ticaret Modu seçimini kullanarak daha yüksek bir zaman dilimini referans alır (örneğin, Salınım için Günlük, Günlük Ticaret için 1 Saat, Scalping için 15 Dakika):
- Boğa HTF Eğilimi:
- Koşul: HTF mum açılışından daha yüksek kapanır (HTF Boğa).
- Gösterge Davranışı: Puanlama motoru, Hedef fiyatın (#1 puanlı çizgi) Ask/bid fiyatının altında işaretlendiğini gösterir (HTF hedefi iç likiditeyi, LTF hedef fiyatı dış likiditeyi gösterir).
- Ticaret Anlamı: Fiyat, yukarı devam etmeden önce indirimli geri çekilme için aşağıda satış tarafı likiditeyi (SSL) arıyor veya nihai genişleme hedefi olarak yukarıda alış tarafı likiditeyi (BSL) hedefliyor.
- Ayı HTF Eğilimi:
- Koşul: HTF mum açılışından daha düşük kapanır (HTF Ayı).
- Gösterge Davranışı: Puanlama motoru, Hedef fiyatın (#1 puanlı çizgi) Ask/bid fiyatının üzerinde işaretlendiğini gösterir (HTF hedefi iç likiditeyi, LTF hedef fiyatı dış likiditeyi gösterir).
- Ticaret Anlamı: Fiyat, aşağı hareket etmeden önce primli geri çekilme için yukarıda alış tarafı likiditeyi (BSL) arıyor veya aşağıda satış tarafı likiditeyi (SSL) hedefliyor.
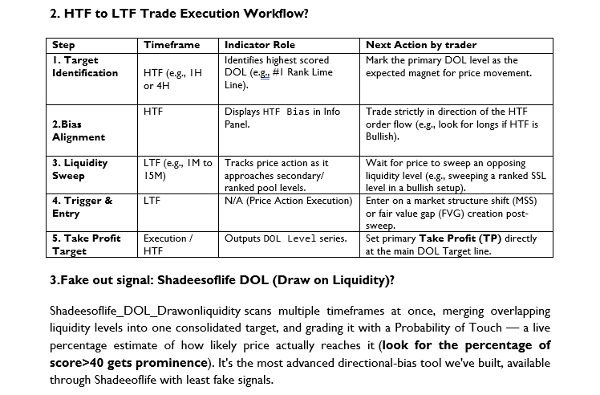
2. HTF'den LTF'ye Ticaret Yürütme İş Akışı?
Cevap için - Ekli resme bakınız (Tablo).
3.Sahte çıkış sinyali: Shadeesoflife DOL (Likidite Üzerine Çizim)?
"Shadeesoflife DOL Likidite Üzerine Çizim" aynı anda birden fazla zaman dilimini tarar, örtüşen likidite seviyelerini tek bir konsolide hedefte birleştirir ve buna Dokunma Olasılığı ile puan verir — fiyatın gerçekten ona ulaşma olasılığının canlı yüzde tahmini (puan yüzdesi>40 olanlar ön plana çıkar). Bu, Shadeeoflife aracılığıyla sunulan en gelişmiş yön eğilimi aracıdır ve en az sahte sinyal verir.
4. "Shadeesoflife DOL Likidite Üzerine Çizim" teknik olarak Örtüşme nasıl çalışır?
"Shadeesoflife DOL Likidite Üzerine Çizim", yön eğilimi için İç likidite, Dış likidite, Emir Blokları, Kırıcı Bloklar, FVG'ler, iFVG'ler ve BSL/SSL'yi tarar. DOL Pro tamamen farklı bir motorla çalışır — EQH/EQL, büyük FVG'ler, oturum sınırları, PDH/PDL ve çoklu zaman dilimlerinde gece/hafta sonu boşluklarını tarar, Judas salınımları ve devamları gibi oturum eğilimini okur ve hedefini canlı Dokunma Olasılığı ile puanlar, çok daha akıllı algoritmalarla. DOL ile aynı yön eğilimi misyonuna sahiptir, daha titiz bir motor üzerine kurulmuştur. Yön ve Yüksek Örtüşme hedef fiyatı sağlayarak yüksek olasılıklı kurulum sonucunu verir.
Birden fazla zaman dilimini aynı anda okur, sadece birini değil, EQH/EQL, büyük FVG'ler, oturum sınırları, PDH/PDL ve gece/hafta sonu boşluklarını tarar. Oturum eğilimini okur — Judas salınımları ve devamları gibi kalıplar.
┌──────────────────────────────────────┐
│ ICT / LİKİDİTE KAVRAMLARI │
│ DOL • PDH • PDL • Oturum • HTF │
│ Likidite • Eşit Yüksek/Düşük │
└──────────────────┬───────────────────┘
↓
┌──────────────────────────────────────┐
│ SMC / YAPI KATMANI │
│ Salınım Yüksek • Salınım Düşük │
│ Likidite Havuzları • HTF Yönü │
└──────────────────┬───────────────────┘
↓
┌─────────────────────────────────────────┐
│ SHADEESOFLIFE QUANT MOTORU │
│ Yakınlık X% + Tazelik Y% + Örtüşme Z% + Yoğunluk A% │
│ → 0–100 Puan → Sıralama #1/#2/#3 → Dinamik DOL │
└─────────────────────────────────────────┘
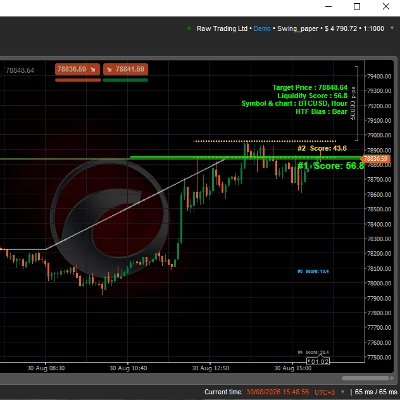
📊Teknik Grafik Ayrıntısı (ekli Resim Yorumlama)
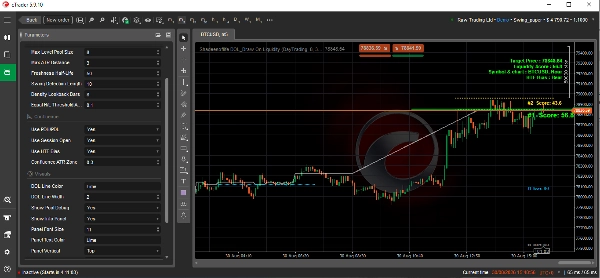
Bu grafik, cTrader Ticaret Platformundan alınmıştır ve BTCUSD (Bitcoin / ABD Doları) 5 dakikalık (m5) zaman diliminde gösterilmektedir. Akıllı Para Kavramları (SMC) kullanılarak yapılandırılmış özel otomatik piyasa yapısı göstergesi "Shadeesoflife DOL Likidite Üzerine Çizim" içerir.
🔎 Temel Teknik Metrikler ve Analiz
- Mevcut Fiyat: Varlık 78.856,48 seviyesinde işlem görüyor ve çok dar, yüksek likidite aralığında sıkışmış durumda.
- Hedef Fiyat / Likidite Üzerine Çizim (DOL): 78.848,64 seviyesinde parlak yeşil yatay çizgi ile işaretlenmiştir. Bu, fiyat hareketi için belirgin bir mıknatıs görevi görür.
- Likidite Puanı (57,3): Bu cepteki istikrarlı ancak aşırı olmayan bekleyen kurumsal emirleri gösteren orta düzeyde bir puan.
- Yüksek Zaman Dilimi (HTF) Eğilimi: Açıkça Ayı (Bear) olarak etiketlenmiştir. Sistem, bekleyen alış likiditesi temizlendikten sonra aşağı yönlü devam arıyor.
- Algoritmik Öncelik Puanları:
- #1 Puan (57,3): Yeşil hedef çizgisinin tam üzerinde yer alır.
- #2 Puan (45,8): Kırmızı temel çizgi seviyesinde biraz daha yukarıda beklemektedir.
💡 Temel Stratejik Yorum
Gösterge, piyasa motorunun belirli kurumsal havuzları süpürmeyi hedeflediği klasik bir SMC kurulumunu haritalıyor.
- Mıknatıs Etkisi: Fiyat, prim bölgesine doğru yukarı itildi ve şimdi 78.848,64 seviyesindeki yeşil Likidite Üzerine Çizim (DOL) temel çizgisine doğru güçlü şekilde çekiliyor.
- Trend Uyumu: Yapısal HTF Eğilimi Ayı olduğundan, bu yerel aşağı çekilme DOL çizgisine doğru baskın trendle mükemmel uyum içindedir.
- Likidite Temizliği: Fiyat bu yeşil çizgideki bekleyen likiditeyi hedefleyip temizledikten sonra, tüccarlar genellikle belirleyici yapısal bir kırılma veya makro ayı yönünde agresif bir devam hareketi bekler.
Not:
- BTCUSD, XAUUSD, GBPUSD veya herhangi bir sembolde kullanılabilir.
- Yukarıdaki BTCUSD analizi, grafik LTF 5m (grafik manuel seçimi) ve HTF 1GÜN (Parametre “Trade Mode” açılır menüden Günlük ticaret için seçilmiştir) baz alınarak yapılmıştır.
- Gösterge, (“Trade Mode” parametre seçimi zaman dilimi ile BIAS uyumlu olacak şekilde) kullanılabilir
- Scalping- HTF 15Dk, (Varsayılan)
- Günlük ticaret- HTF 1S,
- Salınım ticareti- HTF 1G,
- Dört Saatlik Ticaret- HTF 4S
- "Havuz hata ayıklama göster" parametresi, sıralanmış #1 hariç daha az önemli Hedef örtüşme çizgisini kapatmak için kullanılabilir.
- "Bilgi paneli göster" parametresi, paneli gizlemek için kapatılabilir.
- "Panel", yazı tipi boyutu, metin rengi ve panel konumu (yatay/dikey pozisyon) ile özelleştirilebilir.
- "DOL seviyesi" çizgi konumu X ekseni koordinatında (Fiyat), ilgili Y ekseni koordinatında (Zaman) Sıralanmış #1 Hedef örtüşme çizgisini gösterir.
Özet
The indicator outputs a primary Draw on Liquidity (DOL) target line representing the highest-scored liquidity level, along with secondary ranked targets. It provides an on-screen panel displaying higher timeframe (HTF) bias and target metrics, supporting trading styles from scalping to swing trading by referencing appropriate HTFs (e.g., 15-minute for scalping, daily for swing).
Shadeesoflife DOL integrates multi-timeframe analysis, scanning equal highs/lows, fair value gaps, session boundaries, previous day highs/lows, and gaps to assess directional bias and price magnet levels. It calculates a live Probability of Touch (PoT) percentage estimating the likelihood of price reaching each target.
Traders use the indicator to align trades with HTF bias, identify liquidity sweeps on lower timeframes, and set entries and take profit targets at ranked liquidity pools. It supports markets including BTCUSD and XAUUSD and offers customizable display options for target lines and info panels.