
Mô tả
⚡ Tỷ lệ Hiệu quả Kaufman (KER) – Phiên bản Miễn phí
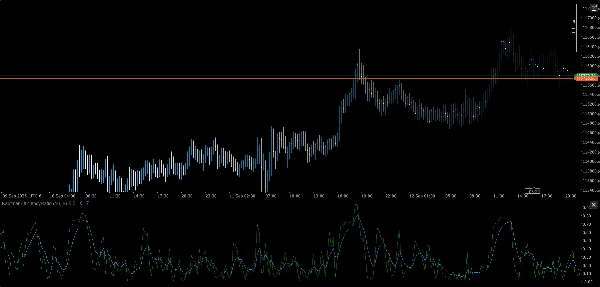
Độ rõ xu hướng, được định lượng.
Tỷ lệ Hiệu quả Kaufman (KER) là công cụ chính xác để đo lường mức độ hiệu quả của giá di chuyển từ điểm A đến B—mà không bị lẫn vào tiếng ồn. Dù bạn đang xác nhận điều kiện bứt phá hay lọc các dao động ngang, KER cung cấp cho bạn một điểm số rõ ràng từ 0 đến 1 phản ánh ý định hướng đi so với biến động.
🔍 Nó làm gì
- Tính toán Tỷ lệ Hiệu quả của Kaufman:
- Xuất ra giá trị chuẩn hóa từ 0 (tiếng ồn thuần túy) đến 1 (xu hướng hoàn hảo)
- Làm nổi bật các chế độ xu hướng và không xu hướng mà không có sự mơ hồ
- Lý tưởng cho các lớp phủ thích ứng, bộ lọc chế độ và cổng tín hiệu
🛠️ Tính năng chính
- Trình quản lý đầu vào mô-đun cho nguồn dữ liệu đa khung thời gian
- Tương thích đa tài sản: FX, tiền điện tử, chỉ số, cổ phiếu
- Logic nhẹ, thời gian thực không có độ trễ làm mượt
- Cắm và chạy với kiến trúc bộ công cụ hiện có của bạn
🎯 Các trường hợp sử dụng
- Xác nhận xu hướng: Xác nhận thiên hướng hướng đi trước khi thực hiện tín hiệu
- Lọc tiếng ồn: Ngăn chặn các lệnh vào trong giai đoạn hành động giá kém hiệu quả
- Phát hiện chế độ: Kết hợp với các lớp phủ nhận biết biến động để chuyển đổi thông minh hơn
- Xây dựng chiến lược: Sử dụng làm chỉ số cốt lõi trong logic bứt phá, động lượng hoặc thiên hướng
💡 Thêm vào
KER miễn phí, nhanh và cực kỳ hiệu quả—giống như mã của bạn. Không rườm rà, không bộ lọc. Chỉ có ý định thị trường thô, được chưng cất.
Tóm tắt
Hồ sơ chỉ báo
Đánh giá của khách hàng
0.0
Đánh giá: 0
Đánh giá của khách hàng
Sản phẩm này chưa có đánh giá nào. Bạn đã dùng thử chưa? Hãy là người đầu tiên chia sẻ với mọi người!
Thảo luận
Câu hỏi thường gặp
Signal
Breakout
Các sản phẩm có sẵn trên cTrader Store, bao gồm bot giao dịch, chỉ báo và plugin, được cung cấp bởi các nhà phát triển bên thứ ba và chỉ nhằm mục đích cung cấp thông tin và tiếp cận kỹ thuật. cTrader Store không phải là nhà môi giới và không cung cấp lời khuyên đầu tư, khuyến nghị cá nhân hay bất kỳ đảm bảo nào về hiệu suất trong tương lai.


Giá
26
Lượt bán
2.18K
Cài đặt miễn phí