Mô tả
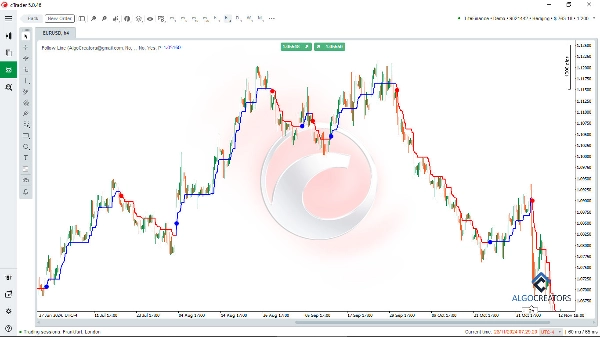
Chỉ báo Follow Line là một chỉ báo cTrader mạnh mẽ cho phân tích kỹ thuật, giúp các nhà giao dịch xác định điểm vào và điểm ra tối ưu trên thị trường tài chính. Bằng cách kết hợp Bollinger Bands và chỉ báo ATR, nó lọc các xu hướng và cung cấp các tín hiệu mua và bán đáng tin cậy.
Với chỉ báo này, bạn có thể dễ dàng phát hiện các xu hướng thị trường đi lên hoặc đi xuống và theo dõi các tín hiệu có độ tin cậy cao.
Các nhà giao dịch có thể kết hợp Chỉ báo Follow Line với các công cụ nâng cao như chỉ báo Smart Money Assistant của cTrader và các bộ dao động liên kết MACD để nâng cao phân tích và xác nhận các điểm vào lệnh.
Các cài đặt tùy chỉnh và cảnh báo thời gian thực của nó làm cho nó trở thành một bổ sung giá trị cho bất kỳ chiến lược giao dịch nào, giúp người dùng thực hiện các giao dịch thành công với sự tự tin và chính xác.
Các tính năng chính:
- Phát hiện xu hướng: Sử dụng Follow Line để xác định các xu hướng thị trường tăng hoặc giảm.
- Tín hiệu Mua/Bán: Hiển thị các tín hiệu mua và bán chính xác dựa trên các đột phá của Bollinger Bands.
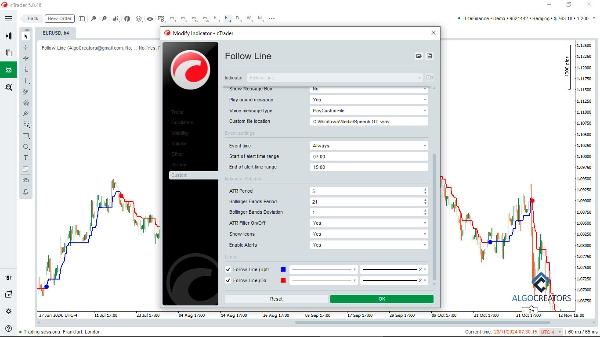
- Bộ lọc ATR: Tùy chọn bật hoặc tắt bộ lọc ATR để tăng độ chính xác của tín hiệu.
- Cài đặt tùy chỉnh: Điều chỉnh chu kỳ Bollinger Bands, độ lệch chuẩn và chu kỳ ATR.
- Biểu diễn trực quan: Hiển thị tín hiệu trên biểu đồ bằng các biểu tượng trực quan (mũi tên hoặc đường).
- Cảnh báo: Nhận cảnh báo ngay lập tức mỗi khi xuất hiện tín hiệu mua hoặc bán.
Chỉ báo này có khả năng tùy chỉnh cao, cho phép các nhà giao dịch điều chỉnh chu kỳ Bollinger Bands, độ lệch chuẩn và các cài đặt ATR phù hợp với chiến lược của họ. Các tín hiệu trực quan và cảnh báo ngay lập tức làm cho nó thân thiện với người dùng và hiệu quả cho cả giao dịch lướt sóng và giao dịch dao động. Với các tính năng như phát hiện xu hướng, quản lý rủi ro và cài đặt tùy chỉnh, Chỉ báo Follow Line là lựa chọn lý tưởng cho các nhà giao dịch forex, tiền điện tử và cổ phiếu nhằm nâng cao phân tích kỹ thuật và hiệu suất giao dịch của họ.
Hoàn hảo để xác định các cơ hội thị trường chính xác!
Tóm tắt
Users can customize settings such as Bollinger Bands period, standard deviation, and ATR period to align with their trading strategies. The indicator visually represents signals on the chart using intuitive icons like arrows or lines and provides real-time alerts when signals occur. It supports various trading styles, including scalping and swing trading, and is suitable for forex, cryptocurrency, and stock markets.
The Follow Line indicator can be combined with other tools like the cTrader Smart Money Assistant and MACD oscillators to confirm trade entries and enhance analysis. Its customizable features and alert system assist traders in identifying precise market opportunities and managing risk effectively.
Đánh giá của khách hàng
5 | 60 % | |
4 | 20 % | |
3 | 20 % | |
2 | 0 % | |
1 | 0 % |