Mô tả
🚀 Biến Biểu Đồ Của Bạn Thành Trung Tâm Quyết Định Chiến Lược
Smart Tech Analysis không chỉ là một chỉ báo.
Nó là một bảng điều khiển phân tích thông minh hoàn chỉnh, được phát triển cho các nhà giao dịch muốn sự rõ ràng, chính xác và nhanh nhẹn trong việc ra quyết định.
Trong khi hầu hết các chỉ báo chỉ cung cấp thông tin riêng lẻ, Smart Tech Analysis tích hợp:
✔ Xu hướng
✔ Khối lượng
✔ Fibonacci
✔ Hỗ trợ và Kháng cự
✔ Tín hiệu kỹ thuật
✔ Khuyến nghị vận hành
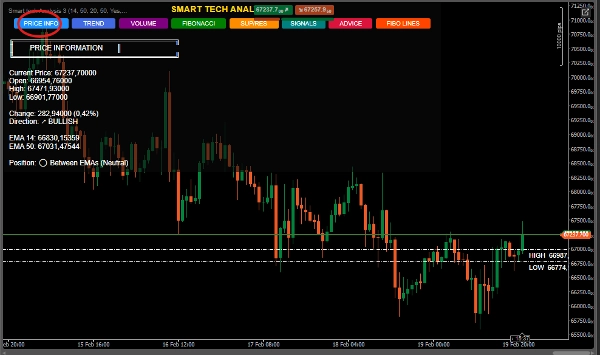
✔ Thông tin giá chi tiết
Tất cả trong một bảng điều khiển động và tương tác duy nhất.
🔥 SỰ KHÁC BIỆT LỚN
🎯 1. Hệ Thống 6-trong-1 – Phân Tích Tích Hợp
Bạn không còn cần phải chuyển đổi giữa nhiều chỉ báo nữa.
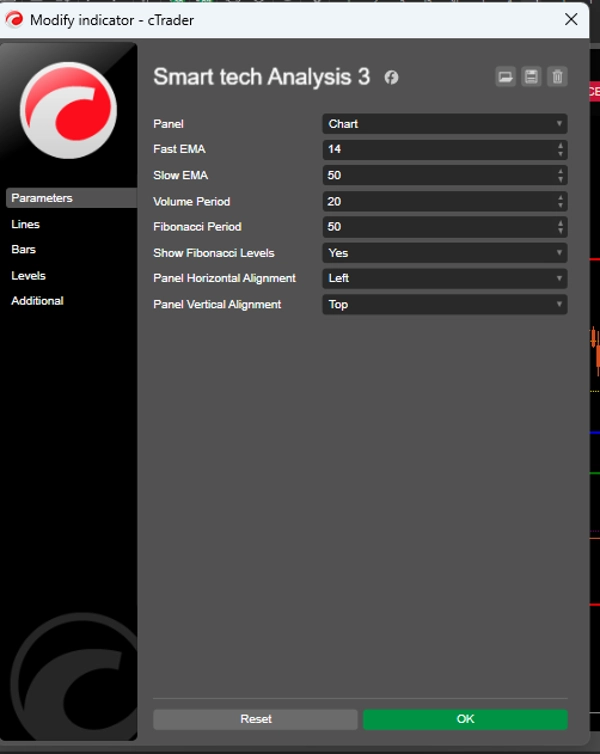
Smart Tech Analysis kết hợp:
📈 EMA nhanh và chậm (14 và 50)
📊 Khối lượng với phân tích so sánh
🧩 Fibonacci tự động
🛡 Hỗ trợ và kháng cự động
🚦 Tạo tín hiệu thông minh
📌 Khuyến nghị với điểm dừng và mục tiêu đã tính toán
👉 Điều này giảm thiểu nhiễu thị giác và tăng tính khách quan.
🧠 2. Bảng Điều Khiển Tương Tác Độc Quyền
Giao diện chuyên nghiệp với các nút thông minh:
THÔNG TIN GIÁ
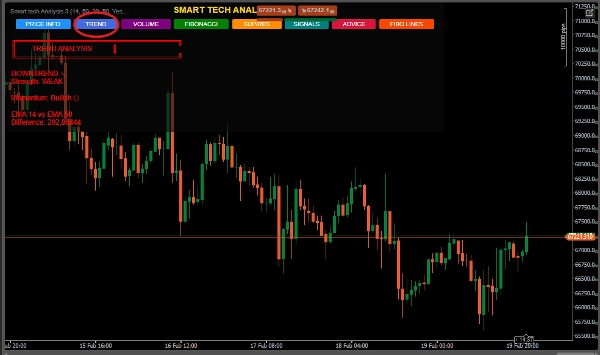
XU HƯỚNG
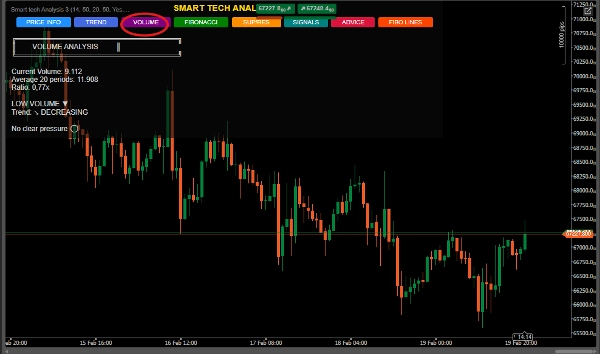
KHỐI LƯỢNG
FIBONACCI
HỖ TRỢ/KHÁNG CỰ
TÍN HIỆU
LỜI KHUYÊN
Nhà giao dịch chọn chính xác những gì họ muốn xem.
📌 Tổ chức.
📌 Kiểm soát.
📌 Tính chuyên nghiệp.
📈 3. Phân Tích Xu Hướng với Độ Mạnh và Đà
Nó không chỉ hiển thị xu hướng tăng hay giảm.
Nó tính toán:
Cường độ xu hướng
Phần trăm sức mạnh giữa các EMA
Phân loại: Yếu, Trung bình hoặc Mạnh
Điều này tránh các điểm vào yếu trong thị trường đi ngang.
📊 4. Khối Lượng với Đọc Thông Tin Tổ Chức
Hệ thống xác định:
Khối lượng cực đoan
Áp lực mua hoặc bán
Tăng tốc hoặc giảm tốc
So sánh với trung bình lịch sử
👉 Lý tưởng để phát hiện hoạt động tổ chức có thể xảy ra.
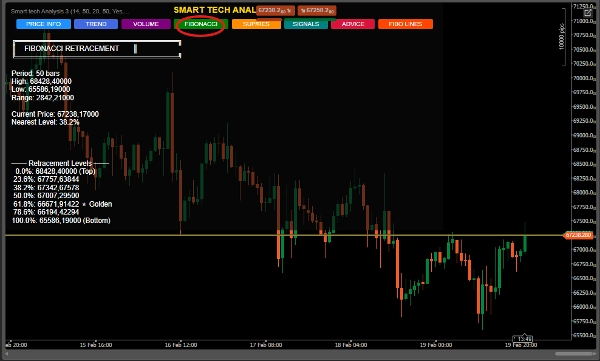
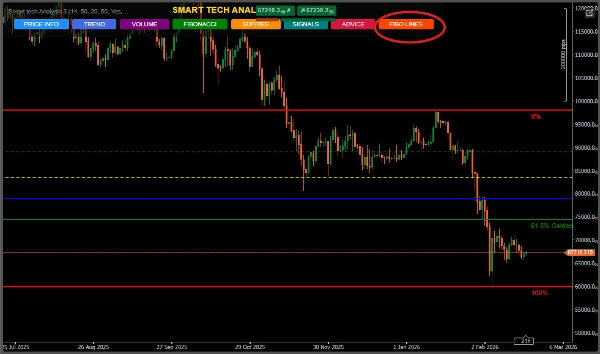
🧩 5. Fibonacci Tự Động với Vùng Vàng
Tính toán động trên khoảng thời gian đã xác định.
Nổi bật đặc biệt cho:
⭐ Vùng 61.8% (Vùng Vàng)
📌 Xác định mức gần nhất
📌 Mở rộng tăng và giảm
📌 Khuyến nghị ngữ cảnh tự động
Hoàn hảo cho các nhà giao dịch hồi quy và giao dịch dao động.
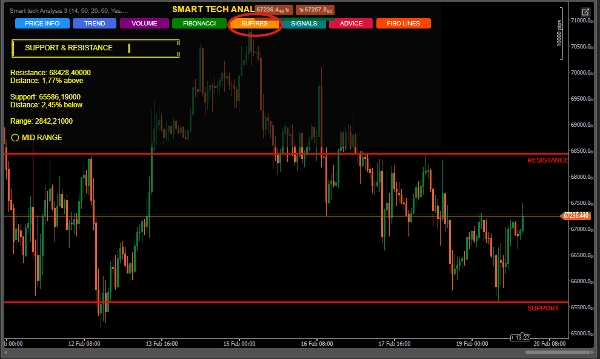
🛡 6. Hỗ Trợ & Kháng Cự Thông Minh
Phát hiện các đỉnh và đáy quan trọng
Hiển thị khoảng cách phần trăm so với giá hiện tại
Phân loại vị trí: Gần hỗ trợ, kháng cự hoặc vùng giữa
Vẽ các đường tự động trên biểu đồ
Lý tưởng để vào các vùng chiến lược.
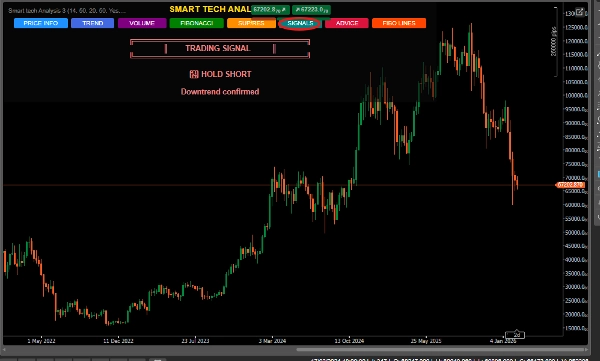
🚦 7. Hệ Thống Tín Hiệu Hội Tụ
Thuật toán không tạo ra các tín hiệu ngẫu nhiên.
Nó kết hợp:
✔ Giao cắt EMA
✔ Gần hỗ trợ/kháng cự
✔ Cấu trúc xu hướng
✔ Ngữ cảnh giá
Phân loại:
🟢 MUA MẠNH
🔴 BÁN MẠNH
📈 GIỮ DÀI
📉 GIỮ NGẮN
⏸ CHỜ
Với mức độ tin cậy được chỉ định.
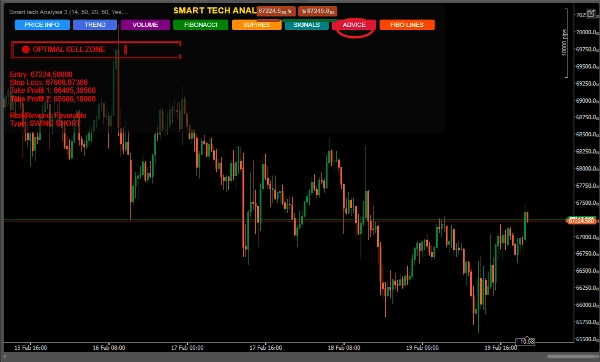
🎯 8. Khuyến Nghị với Quản Lý Rủi Ro
Bảng "LỜI KHUYÊN" cung cấp:
Gợi ý điểm vào
Điểm dừng kỹ thuật
Hai mục tiêu chốt lời
Cấu trúc dao động (Dài hoặc Ngắn)
Ngữ cảnh vận hành
👉 Nó không chỉ là phân tích.
👉 Nó là một kế hoạch có cấu trúc.
🏆 Ai là người phù hợp với chỉ báo này?
✔ Nhà giao dịch mới cần sự rõ ràng
✔ Nhà giao dịch trung cấp muốn sự hội tụ
✔ Nhà giao dịch nâng cao tìm kiếm hiệu quả
✔ Nhà giao dịch dao động
✔ Nhà giao dịch lướt sóng sử dụng xác nhận cấu trúc
💎 Tại sao nó nổi bật trên thị trường? Chỉ Báo Thông Thường Smart Tech Analysis
Thông Tin Riêng Lẻ Phân Tích Tích Hợp Nhiễu Thị Giác Bảng Điều Khiển Có Tổ Chức Không Có Ngữ Cảnh Hội Tụ Kỹ Thuật Không Quản Lý Điểm Dừng và Mục Tiêu Đề Xuất Tín Hiệu Đơn Giản Tín Hiệu Có Xác Nhận
📊 Lợi Ích Trực Tiếp
✔ Giảm quyết định theo cảm xúc
✔ Tăng độ chính xác
✔ Cải thiện đọc cấu trúc
✔ Tiết kiệm thời gian
✔ Nâng cao tiêu chuẩn chuyên nghiệp của nhà giao dịch
🧠 Vị Trí Thị Trường
Smart Tech Analysis lý tưởng cho:
Thị Trường Forex
Chỉ số
Hàng hóa
Tiền điện tử


![Logo "[Stellar Strategies] Inside Bar with Signals"](https://cdn.ctrader.com/image/webp/1d9e8bfa-3b2c-4440-bb37-5856902008a7_30683)


