Mô tả
Tổng quan chỉ số
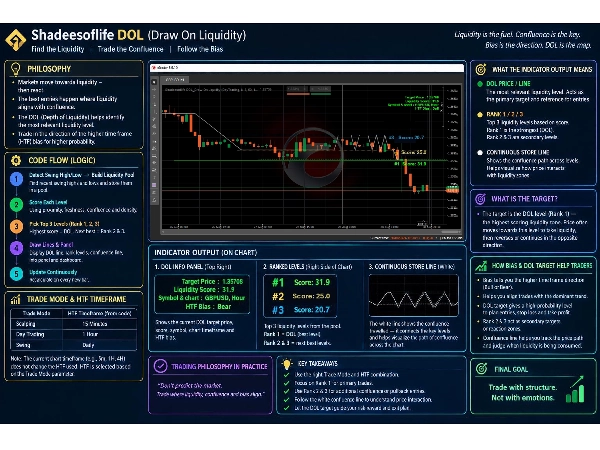
Chỉ báo Shadeesoflife DOL (Draw on Liquidity) c Trader cung cấp một động cơ xác định mục tiêu động dựa trên các Khái niệm Tiền Thông Minh (SMC) và nguyên tắc ICT. Nó tự động vẽ một Đường trên Thanh khoản (DOL), xếp hạng và theo dõi các nhóm thanh khoản cấu trúc - "Sự hội tụ cao" trên thị trường tại mỗi tick. DOL là một mục tiêu động, thanh khoản hội tụ cao.
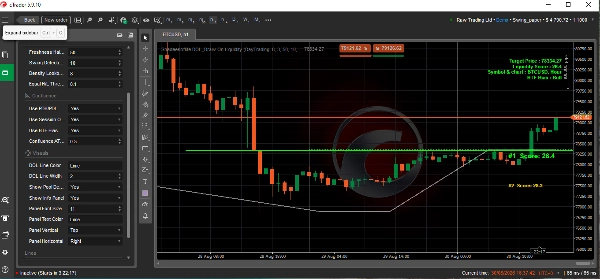
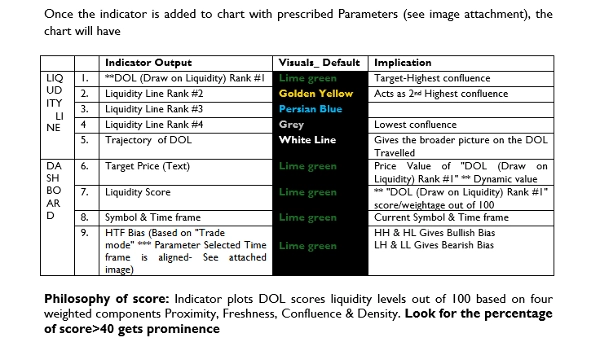
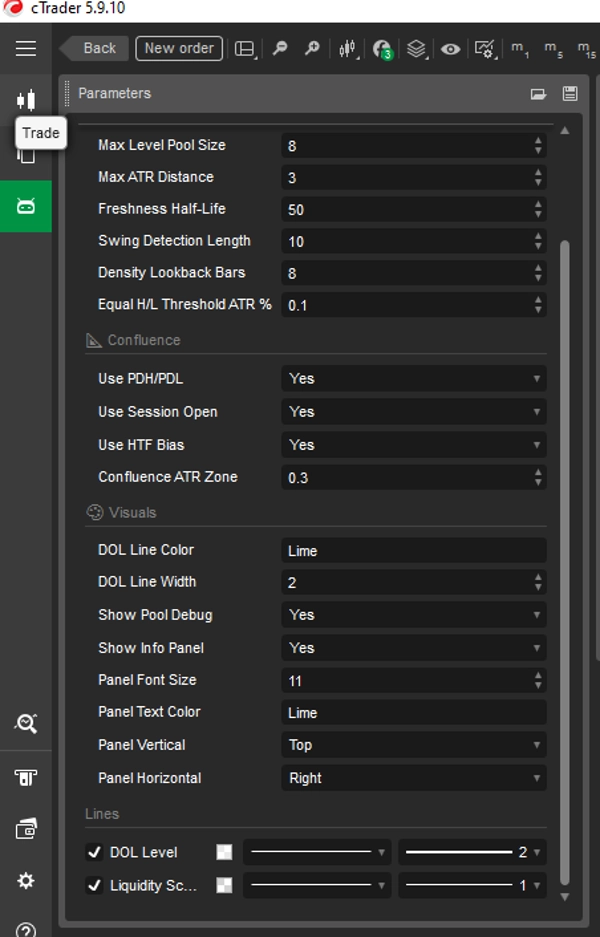
Chỉ báo xuất ra một Mục tiêu DOL chính (mức điểm cao nhất, hiển thị dưới dạng đường nổi bật) cùng với một nhóm mục tiêu thanh khoản phụ được xếp hạng, đồng thời cung cấp một bảng điều khiển trên màn hình hiển thị xu hướng HTF hiện tại và các chỉ số mục tiêu. Khi chỉ báo được thêm vào biểu đồ với các Tham số quy định (xem hình đính kèm), biểu đồ sẽ có
Để trả lời - Tham khảo hình đính kèm (Bảng).
Triết lý điểm số: Chỉ báo vẽ điểm DOL các mức thanh khoản trên 100 dựa trên bốn thành phần trọng số Gần gũi, Mới mẻ, Hội tụ & Mật độ.
Câu hỏi thường gặp
1.Cách hoạt động - Khung Chiến lược Đa khung thời gian HTF & LTF??
Xác định Xu hướng và Hướng của Khung Thời gian Cao hơn (HTF)
Chỉ báo xác định xu hướng cấu trúc sử dụng lựa chọn Chế độ Giao dịch cơ sở để tham chiếu khung thời gian cao hơn (ví dụ, ***Hàng ngày cho Swing, 1 giờ cho Giao dịch trong ngày, 15 phút cho Scalping):
- Xu hướng HTF tăng giá:
- Điều kiện: Nến HTF đóng cửa cao hơn giá mở (HTF Tăng).
- Hành vi chỉ báo: Động cơ chấm điểm hiển thị Giá mục tiêu (đường gắn điểm số #1) được đánh dấu dưới giá Ask/bid (mục tiêu HTF hiển thị thanh khoản nội bộ và giá mục tiêu LTF hiển thị thanh khoản bên ngoài).
- Ý nghĩa giao dịch: Giá đang tìm kiếm thanh khoản bên bán (SSL) bên dưới để điều chỉnh giảm giá trước khi tiếp tục tăng lên, hoặc nhắm tới thanh khoản bên mua (BSL) bên trên như mục tiêu mở rộng cuối cùng.
- Xu hướng HTF giảm giá:
- Điều kiện: Nến HTF đóng cửa thấp hơn giá mở (HTF Giảm).
- Hành vi chỉ báo: Động cơ chấm điểm hiển thị Giá mục tiêu (đường gắn điểm số #1) được đánh dấu trên giá Ask/bid (mục tiêu HTF hiển thị thanh khoản nội bộ và giá mục tiêu LTF hiển thị thanh khoản bên ngoài).
- Ý nghĩa giao dịch: Giá đang tìm kiếm thanh khoản bên mua (BSL) bên trên để điều chỉnh tăng giá trước khi di chuyển xuống dưới, hoặc nhắm tới thanh khoản bên bán (SSL) bên dưới.
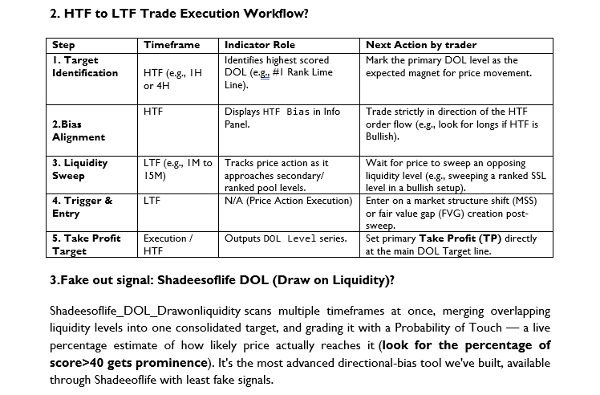
2. Quy trình thực thi giao dịch từ HTF đến LTF?
Để trả lời - Tham khảo hình đính kèm (Bảng).
3.Tín hiệu giả: Shadeesoflife DOL (Draw on Liquidity)?
"Shadeesoflife DOL Draw on liquidity" quét nhiều khung thời gian cùng lúc, hợp nhất các mức thanh khoản chồng chéo thành một mục tiêu hợp nhất, và đánh giá nó với Xác suất Chạm — một ước tính phần trăm trực tiếp về khả năng giá thực sự đạt tới nó (tìm phần trăm điểm số>40 được ưu tiên). Đây là công cụ định hướng xu hướng tiên tiến nhất mà chúng tôi đã xây dựng, có sẵn qua Shadeeoflife với ít tín hiệu giả nhất.
4. Cách Hội tụ trong "Shadeesoflife DOL Draw on liquidity" hoạt động kỹ thuật như thế nào?
"Shadeesoflife DOL Draw on liquidity" quét Thanh khoản nội bộ, Thanh khoản bên ngoài, Khối lệnh, Khối phá vỡ, FVGs, iFVGs, và BSL/SSL cho xu hướng định hướng của nó. DOL Pro chạy trên một động cơ hoàn toàn khác — nó quét EQH/EQL, FVGs lớn, ranh giới phiên, PDH/PDL, và các khoảng trống qua đêm/cuối tuần trên nhiều khung thời gian, đọc xu hướng phiên như các dao động Judas và tiếp diễn, và đánh giá mục tiêu với Xác suất Chạm trực tiếp, với các thuật toán thông minh hơn nhiều. Cùng nhiệm vụ định hướng xu hướng như DOL, xây dựng trên một động cơ nghiêm ngặt hơn. Cung cấp kết quả của thiết lập xác suất cao bằng cách cung cấp Hướng và Mục tiêu Hội tụ Cao hơn.
Đọc nhiều khung thời gian cùng lúc, không chỉ một, Quét EQH/EQL, FVGs lớn, ranh giới phiên, PDH/PDL, và các khoảng trống qua đêm/cuối tuần. Đọc xu hướng phiên — các mẫu như dao động Judas và tiếp diễn.
┌──────────────────────────────────────┐
│ NGUYÊN TẮC ICT / THANH KHOẢN │
│ DOL • PDH • PDL • Phiên • HTF │
│ Thanh khoản • Cao/Thấp bằng nhau │
└──────────────────┬───────────────────┘
↓
┌──────────────────────────────────────┐
│ LỚP CẤU TRÚC / SMC │
│ Swing High • Swing Low │
│ Các nhóm thanh khoản • Hướng HTF │
└──────────────────┬───────────────────┘
↓
┌─────────────────────────────────────────┐
│ ĐỘNG CƠ ĐỊNH LƯỢNG SHADEESOFLIFE │
│ Gần gũi X% + Mới mẻ Y% + Hội tụ Z% + Mật độ A% │
│ │
│ → Điểm số 0–100 → Xếp hạng #1/#2/#3 → DOL động │
└─────────────────────────────────────────┘
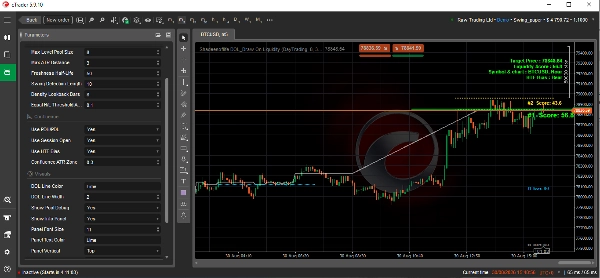
📊Phân tích Biểu đồ Kỹ thuật (Diễn giải Hình ảnh đính kèm)
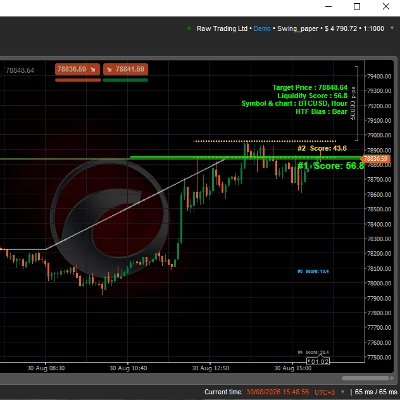
Biểu đồ này từ Nền tảng Giao dịch cTrader hiển thị BTCUSD (Bitcoin / Đô la Mỹ) trên khung thời gian 5 phút (m5). Nó có một chỉ báo cấu trúc thị trường tự động tùy chỉnh gọi là "Shadeesoflife DOL Draw On Liquidity", được cấu hình sử dụng Khái niệm Tiền Thông Minh (SMC).
🔎 Các chỉ số kỹ thuật chính & Phân tích
- Giá hiện tại: Tài sản đang giao dịch ở mức 78,856.48, dao động chặt chẽ trong một phạm vi rất hẹp và thanh khoản cao.
- Giá mục tiêu / Đường trên Thanh khoản (DOL): Được đánh dấu bằng đường ngang màu xanh lá cây sáng chắc chắn tại 78,848.64. Đây là nam châm nổi bật cho hành động giá.
- Điểm Thanh khoản (57.3): Điểm số vừa phải cho thấy các lệnh tổ chức ổn định nhưng không quá áp đảo xung quanh vùng này.
- Xu hướng Khung Thời gian Cao hơn (HTF): Được ghi rõ là Giảm giá (Bear). Hệ thống đang tìm kiếm sự tiếp tục giảm sau khi thanh khoản mua nghỉ được xóa bỏ.
- Điểm Ưu tiên Thuật toán:
- Điểm số #1 (57.3): Nằm ngay tại đường mục tiêu màu xanh lá cây.
- Điểm số #2 (45.8): Nằm nghỉ hơi cao hơn tại mức cơ sở màu đỏ.
💡 Diễn giải Chiến lược Cốt lõi
Chỉ báo đang vẽ ra một thiết lập SMC cổ điển nơi động cơ thị trường tìm cách quét các nhóm tổ chức cụ thể.
- Hiệu ứng Nam châm: Giá đã đẩy lên vùng cao cấp và hiện đang hướng mạnh về đường cơ sở màu xanh lá cây Draw on Liquidity (DOL) tại 78,848.64.
- Sự phù hợp xu hướng: Vì xu hướng cấu trúc HTF là Giảm giá, sự kéo giảm cục bộ về đường DOL này hoàn toàn phù hợp với xu hướng chi phối.
- Xóa thanh khoản: Khi giá nhắm mục tiêu và giảm thiểu thanh khoản nghỉ tại đường màu xanh này, các nhà giao dịch thường theo dõi sự phá vỡ cấu trúc quyết đoán hoặc sự tiếp tục mạnh mẽ của hướng giảm vĩ mô.
Lưu ý:
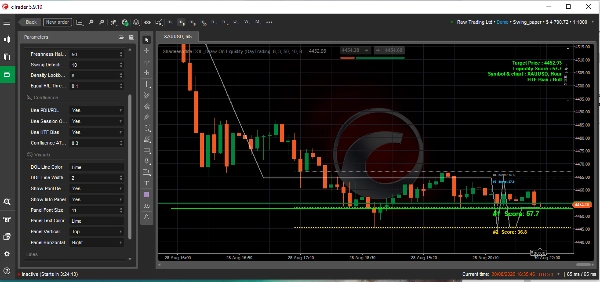
- Có thể sử dụng cho BTCUSD, XAUUSD, GBPUSD hoặc bất kỳ ký hiệu nào.
- Phân tích BTCUSD trên dựa trên biểu đồ LTF 5m (lựa chọn thủ công biểu đồ) và HTF 1DAY (Tham số “Chế độ Giao dịch” để giao dịch trong ngày từ lựa chọn thả xuống).
- Chỉ báo có thể được sử dụng cho (tham số lựa chọn “Chế độ Giao dịch” phù hợp với khung thời gian cho BIAS*)
- Scalping- HTF 15M, (Mặc định)
- Giao dịch trong ngày- HTF 1H,
- Giao dịch Swing- HTF 1D,
- Giao dịch Bốn giờ- HTF 4H
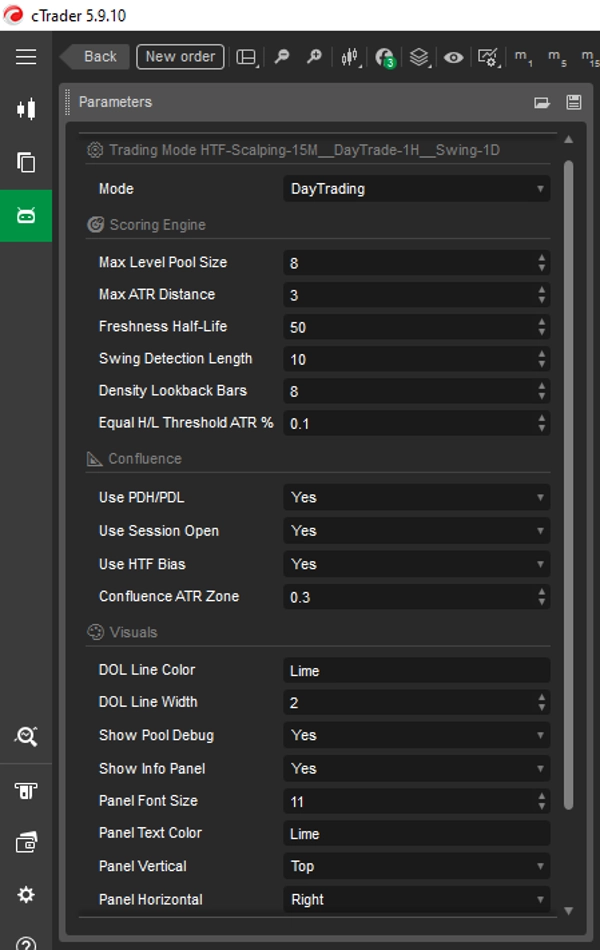
- Tham số "Hiển thị gỡ lỗi nhóm" có thể được sử dụng để tắt đường hội tụ mục tiêu ít quan trọng ngoại trừ xếp hạng #1.
- Tham số "Hiển thị bảng điều khiển" có thể được sử dụng để tắt ẩn bảng điều khiển.
- "Bảng điều khiển" có thể tùy chỉnh với kích thước chữ, màu chữ & vị trí bảng điều khiển (Vị trí ngang/ dọc).
- Vị trí đường "mức DOL" trên trục X (Giá) chỉ ra đường hội tụ mục tiêu xếp hạng #1 tại tọa độ trục Y tương ứng (Thời gian).
Tóm tắt
The indicator outputs a primary Draw on Liquidity (DOL) target line representing the highest-scored liquidity level, along with secondary ranked targets. It provides an on-screen panel displaying higher timeframe (HTF) bias and target metrics, supporting trading styles from scalping to swing trading by referencing appropriate HTFs (e.g., 15-minute for scalping, daily for swing).
Shadeesoflife DOL integrates multi-timeframe analysis, scanning equal highs/lows, fair value gaps, session boundaries, previous day highs/lows, and gaps to assess directional bias and price magnet levels. It calculates a live Probability of Touch (PoT) percentage estimating the likelihood of price reaching each target.
Traders use the indicator to align trades with HTF bias, identify liquidity sweeps on lower timeframes, and set entries and take profit targets at ranked liquidity pools. It supports markets including BTCUSD and XAUUSD and offers customizable display options for target lines and info panels.