
Mô tả
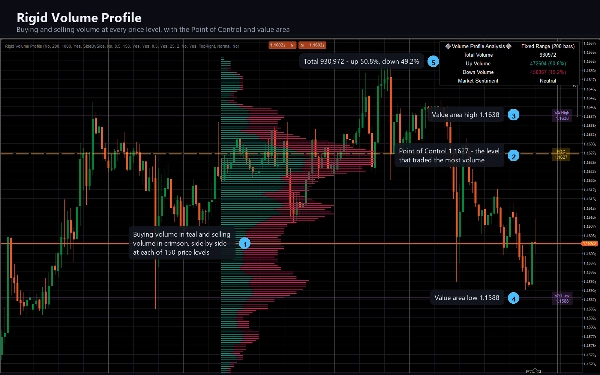
Rigid Volume Profile chia cửa sổ nhìn lại của bạn thành một số mức giá cố định và hiển thị khối lượng giao dịch tại mỗi mức, được phân tách thành áp lực mua và bán.
NHỮNG GÌ NÓ VẼ
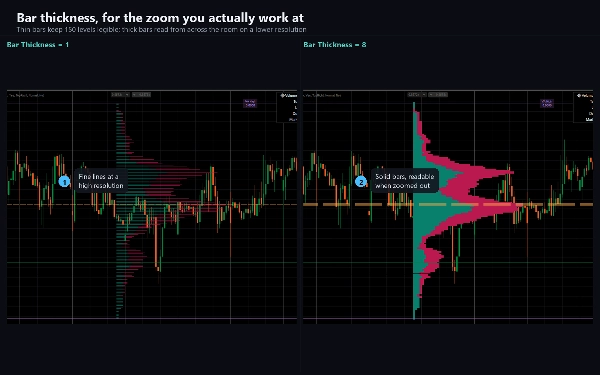
Một biểu đồ ngang bên cạnh hành động giá, được xây dựng từ N thanh gần nhất. Thanh ở mỗi mức được chia thành khối lượng tăng giá (từ các thanh đóng cửa tăng) và khối lượng giảm giá (từ các thanh đóng cửa giảm), vì vậy bạn có thể thấy không chỉ nơi giao dịch diễn ra mà còn bên nào đang thực hiện. Các thanh đóng cửa không đổi chia đều khối lượng của chúng giữa hai bên.
Một đường Điểm Kiểm Soát (Point of Control) nét đứt đánh dấu mức giá có khối lượng giao dịch nhiều nhất trong cửa sổ, được gán nhãn với giá chính xác của nó.
Hai đường vùng giá trị giới hạn các mức chiếm 70% khối lượng trong cửa sổ, mỗi đường được gán nhãn.
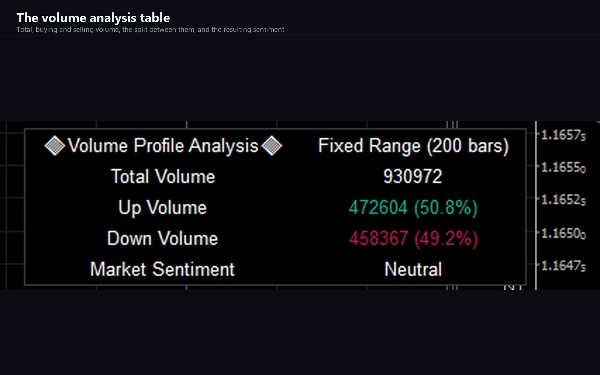
Một bảng phân tích khối lượng báo cáo tổng khối lượng, khối lượng tăng và giảm kèm theo phần trăm, và một chỉ số cảm nhận dựa trên bên nào chiếm ưu thế.
CÁCH SỬ DỤNG
Hồ sơ khối lượng mô tả nơi giao dịch thực sự diễn ra, thay vì nơi giá chỉ di chuyển qua. Một mức hấp thụ nhiều khối lượng là mức mà nhiều người tham gia quan tâm; phần mỏng của hồ sơ là phạm vi giá thị trường di chuyển nhanh qua.
Đọc Điểm Kiểm Soát như trọng tâm của cửa sổ. Đọc vùng giá trị như phạm vi nơi phần lớn giao dịch được thực hiện. Đọc khoảng trống mỏng giữa hai nút nặng như một vùng giá có xu hướng được vượt qua thay vì dừng lại. Quan sát bên nào chiếm ưu thế khi giá quay lại mức đó.
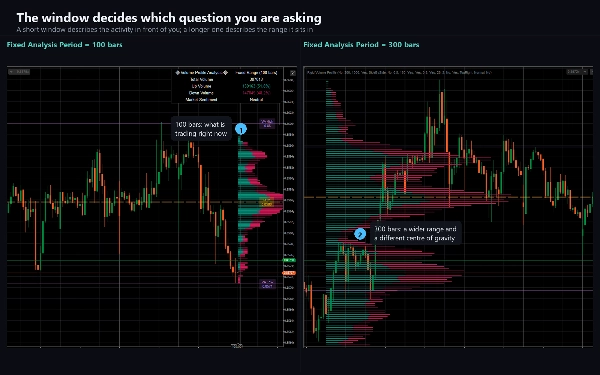
Cửa sổ là do bạn chọn và hình ảnh thay đổi theo đó, vì vậy hãy chọn khoảng nhìn lại phù hợp với quyết định bạn đang đưa ra. Hồ sơ 100 thanh trả lời một câu hỏi khác với hồ sơ 500 thanh.
CÀI ĐẶT CHÍNH
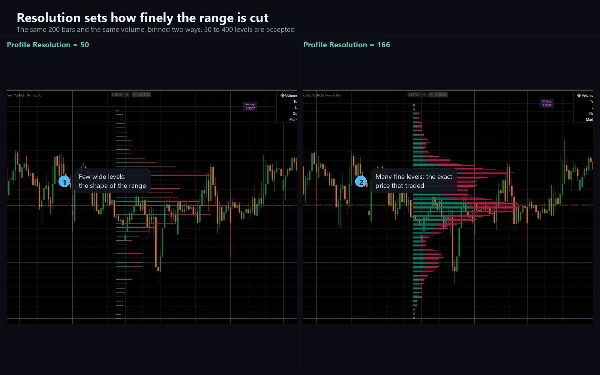
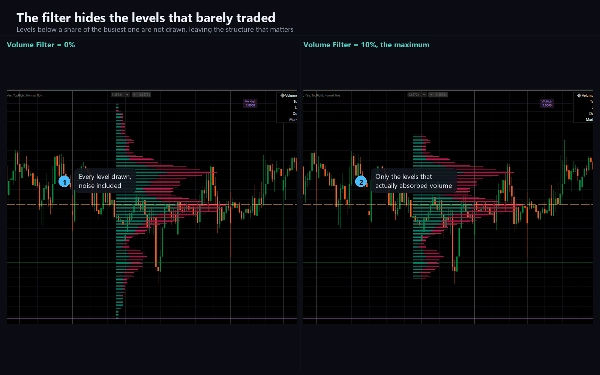
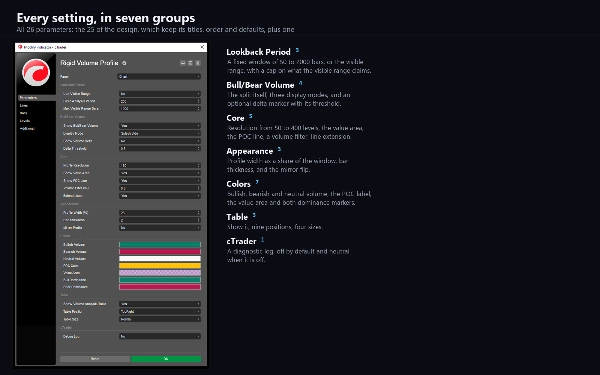
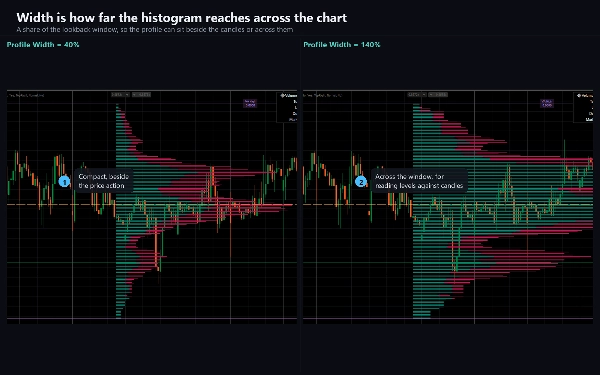
Fixed Analysis Period đặt khoảng nhìn lại theo số thanh, từ 50 đến 2000. Profile Resolution đặt số mức giá mà phạm vi được chia thành, từ 50 đến 400; ít mức hơn đọc như hồ sơ cổ điển, nhiều mức hơn cho chi tiết tinh tế. Display Mode cung cấp các chế độ Side by Side, Stacked và Split. Profile Width điều chỉnh kích thước biểu đồ theo phần trăm của khoảng nhìn lại. Volume Filter ẩn các mức dưới một phần trăm của mức bận rộn nhất. Show Volume Delta thêm một dấu hiệu khi một bên rõ ràng chiếm ưu thế. Mỗi màu có thể điều chỉnh, và bảng phân tích có thể được di chuyển đến bất kỳ trong chín vị trí hoặc tắt đi.
Use Visible Range chuyển khoảng nhìn lại sang các thanh hiện trên màn hình thay vì số lượng cố định.
LOẠI CHỈ BÁO VÀ CỬA SỔ
Lớp phủ biểu đồ. Nó vẽ trên biểu đồ giá chính, không phải trong một khung riêng biệt.
KHUNG THỜI GIAN VÀ CÔNG CỤ
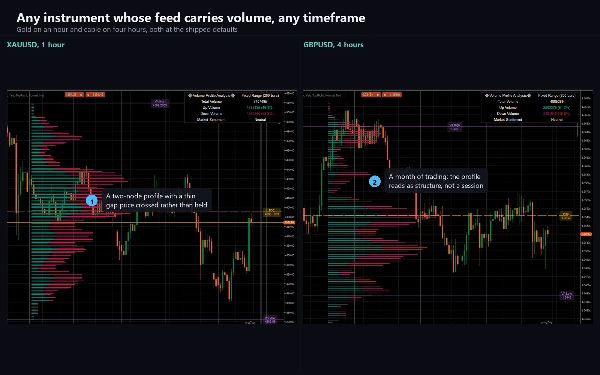
Bất kỳ khung thời gian nào. Nó hữu ích nhất trong ngày, từ M5 đến H4, nơi phân phối khối lượng trong một phiên là một đối tượng có ý nghĩa.
Hoạt động trên bất kỳ công cụ nào có dữ liệu khối lượng. Trên forex đó là khối lượng tick, số lần cập nhật giá mỗi thanh, là đại diện cho hoạt động hơn là kích thước giao dịch thực tế. Trên các CFD chỉ số và hàng hóa, một số nhà môi giới cung cấp khối lượng giao dịch thực tế, và hồ sơ có ý nghĩa hơn ở đó. Trên công cụ không có khối lượng, không có gì được vẽ.
DÀNH CHO AI
Các nhà giao dịch đã làm việc với hồ sơ khối lượng và muốn một hồ sơ với lưới cố định có thể điều chỉnh và phân tách rõ ràng giữa mua và bán, thay vì hồ sơ phiên cố định.
DÙNG THỬ
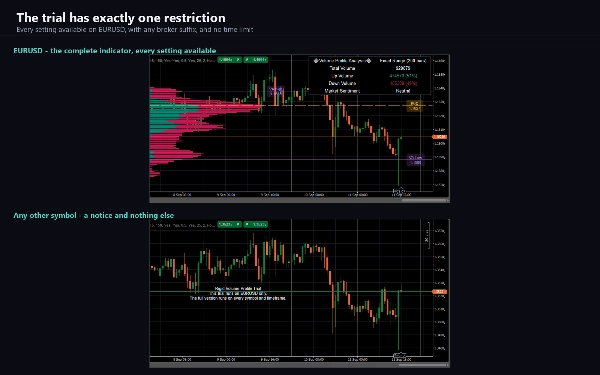
Một phiên bản dùng thử được đính kèm với sản phẩm này. Đây là chỉ báo đầy đủ với mọi cài đặt có sẵn, giới hạn cho EURUSD. Phiên bản đầy đủ loại bỏ giới hạn đó và không thêm gì khác.
GHI CHÚ KỸ THUẬT VÀ HẠN CHẾ
Hồ sơ được tính lại trên mỗi tick của thanh đang hình thành, vì vậy Điểm Kiểm Soát và vùng giá trị di chuyển trong một thanh và ổn định khi thanh đóng cửa. Đây là thiết kế có chủ ý. Không có gì ở đây là tín hiệu thanh đóng cửa.
Ở Profile Resolution trên 166, các mức giá thấp nhất không được vẽ. Đây là giới hạn có chủ ý của thiết kế, dành một số lượng cố định đối tượng vẽ và sử dụng ba đối tượng cho mỗi mức giá; các nút bật tắt Show POC Line và Show Value Area mỗi cái giải phóng một đối tượng. Giữ Profile Resolution ở 166 hoặc thấp hơn để xem toàn bộ hồ sơ.
Vùng giá trị được xây dựng bằng cách xếp hạng các mức theo khối lượng và lấy theo thứ tự đó cho đến khi đạt 70%, sau đó báo cáo mức giá cao nhất và thấp nhất trong số đó. Do đó nó thường rộng hơn vùng giá trị được xây dựng bằng cách đi ra ngoài từ Điểm Kiểm Soát.
Bởi vì hồ sơ được xây dựng từ khối lượng của nhà môi giới của bạn, hai nhà môi giới sẽ không tạo ra hồ sơ giống hệt nhau từ cùng một thị trường.
AccessRights là None: chỉ báo không đặt lệnh, không sửa đổi gì, và không đọc dữ liệu tài khoản.
HỖ TRỢ
Tài liệu bao gồm mọi tham số, các cài đặt gây bất ngờ cho người dùng, và hướng dẫn khắc phục sự cố đi kèm sản phẩm. Các câu hỏi được hoan nghênh qua tab Thảo luận; một báo cáo hữu ích nên ghi rõ ký hiệu, nhà môi giới, khung thời gian, phiên bản cTrader và các cài đặt đã thay đổi so với mặc định.
Giao dịch có rủi ro. Hiệu suất trong quá khứ không đảm bảo kết quả trong tương lai.
Tóm tắt
Users can customize the lookback period (50 to 2000 bars), profile resolution (50 to 400 levels), display mode (side by side, stacked, split), profile width, and volume filtering. The profile updates dynamically on every tick of the forming bar. It supports any timeframe and instruments with volume data, including tick volume for forex and real exchange volume for some CFDs. The indicator is intended for traders familiar with volume profiles seeking detailed buying and selling pressure insights on a fixed grid rather than session-based profiles. A trial version is available with full features restricted to EURUSD.