
DynamicVolumeSupplyDemand
Chỉ báo
1.29K lượt tải
Phiên bản 1.0, Apr 2025
Windows, Mac
4.2
Đánh giá: 5
Mô tả
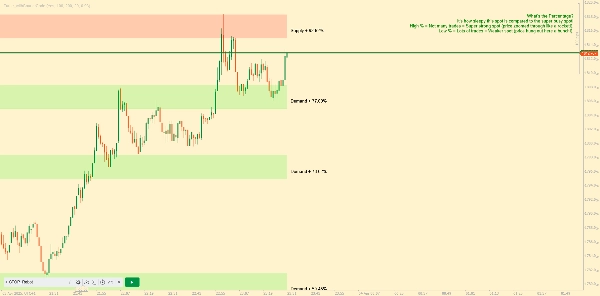
Giới thiệu Vùng Cung và Cầu Động bởi AlgoAlpha được tôi tái tạo cho Nền tảng Ctrader. Chỉ báo này được thiết kế để tự động xác định và trực quan hóa các vùng cung và cầu động trên biểu đồ của bạn, giúp các nhà giao dịch xác định các khu vực đảo chiều tiềm năng và đánh giá tâm lý thị trường với độ rõ nét cao hơn. Nó thích ứng với điều kiện thị trường bằng cách sử dụng cơ chế nhìn lại động, làm cho nó phản ứng nhanh hơn với các biến động giá gần đây. 📈💡
Các Tính Năng Chính
- 📊 Nhìn Lại Động: Tự động điều chỉnh khoảng thời gian nhìn lại dựa trên điểm pivot gần nhất, đảm bảo dữ liệu được phân tích là phù hợp nhất.
- 🎯 Phát Hiện Điểm Pivot: Sử dụng khoảng thời gian do người dùng định nghĩa để phát hiện các điểm pivot cao và thấp quan trọng, đánh dấu các điểm đảo chiều tiềm năng một cách chính xác.
- 🛠 Tham Số Tùy Chỉnh: Cung cấp các tùy chọn tùy chỉnh rộng rãi bao gồm khoảng thời gian nhìn lại, độ nhạy phát hiện pivot, độ phân giải và dung sai vùng.
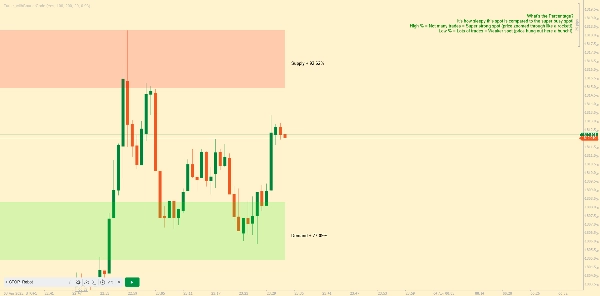
- 🗺 Hiển Thị Trực Quan: Hiển thị các vùng cung và cầu dưới dạng hộp trên biểu đồ, tô nền để phân biệt giữa các vùng tăng giá và giảm giá.
- 🖍 Vùng Màu Mã: Các vùng được mã màu để dễ nhận biết: xanh lá cho vùng tăng giá, đỏ cho vùng giảm giá, và xám cho các mức trung tính.
Tóm tắt
Tóm tắt AI
DynamicVolumeSupplyDemand is an indicator for the cTrader platform that automatically identifies and visualizes dynamic supply and demand zones on trading charts. It helps traders locate potential reversal areas and evaluate market sentiment by adapting to recent price movements through a dynamic look-back mechanism. Key features include:
- Dynamic Look-Back: Automatically adjusts the look-back period based on the latest pivot points to analyze the most relevant data.
- Pivot Point Detection: Uses a user-defined period to detect significant pivot highs and lows, marking potential reversal points.
- Customizable Parameters: Allows adjustment of look-back period, pivot detection sensitivity, resolution, and zone tolerance.
- Visual Display: Presents supply and demand zones as boxes on the chart with background highlighting to distinguish bullish and bearish zones.
- Color-Coded Zones: Zones are color-coded for clarity—green for bullish, red for bearish, and gray for neutral levels.
This indicator supports enhanced clarity in market analysis by dynamically adapting to changing market conditions and providing clear visual cues for supply and demand levels.
Hồ sơ chỉ báo
Đánh giá của khách hàng
4.2
Đánh giá: 5
5 | 40 % | |
4 | 40 % | |
3 | 20 % | |
2 | 0 % | |
1 | 0 % |
Đánh giá của khách hàng
October 12, 2025
Could you please make a new indicator so too remove the explanation and how the indicator works written on the chart? Very nice indicator otherwise!
August 12, 2025
Pros: Identifies dynamic supply and demand zones based on volume. Flexible settings, strong visual clarity. Cons: No alerts or tooltips. Lacks history of previous zones and user template saving.
May 15, 2025
This indicator finds the supply and demand areas very well but it has a problem. But the explanation and how the indicator works written on the chart is very annoying. I hope the designer of this software will solve this problem. Thank you
Thảo luận
Câu hỏi thường gặp
Các sản phẩm có sẵn trên cTrader Store, bao gồm bot giao dịch, chỉ báo và plugin, được cung cấp bởi các nhà phát triển bên thứ ba và chỉ nhằm mục đích cung cấp thông tin và tiếp cận kỹ thuật. cTrader Store không phải là nhà môi giới và không cung cấp lời khuyên đầu tư, khuyến nghị cá nhân hay bất kỳ đảm bảo nào về hiệu suất trong tương lai.


Giá
Kể từ 09/01/2025
11.78K
Cài đặt miễn phí