
说明
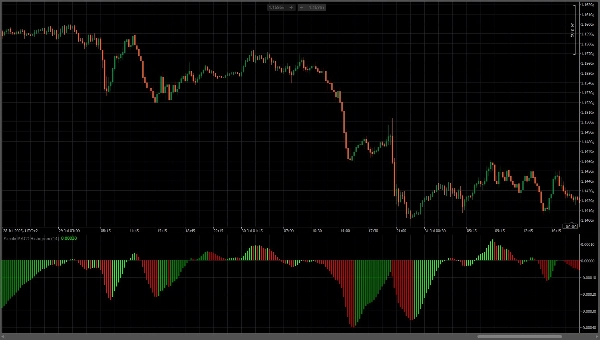
这个自定义MACD柱状图指标以增强的视觉清晰度样式显示MACD柱状图。该指标使用14的快速EMA周期,自动计算慢速EMA为快速加2(16)。该指标具有高度对比的颜色编码,便于即时识别趋势:亮绿色柱表示上升动能(看涨),红色柱表示下降动能(看跌)。柱状图柱从中心零线对称延伸,创建直观的视觉表现,绿色表示买入压力,红色表示卖出压力。这种可视化风格提供清晰、明确的动能信号,有助于识别潜在的趋势反转和价格走势中的动能变化。
摘要
AI 摘要
The Simple MACD Histogram is a custom technical indicator designed to visually represent momentum in price action. It calculates a fast EMA with a period of 14 and a slow EMA set automatically to 16 (fast EMA plus 2). The histogram bars extend symmetrically from a zero line, with bright green bars indicating rising (bullish) momentum and red bars indicating falling (bearish) momentum. This color-coded display enhances clarity for quick trend recognition, helping users identify potential trend reversals and shifts in momentum. The indicator is intended for use in trading analysis to provide clear, unambiguous signals of buy and sell pressure.
指标配置
客户评价
0.0
评价:0
客户评价
该产品尚无评价。已经试过了?抢先告诉其他人!
讨论
常见问答
cTrader Store 提供的所有产品,包括交易机器人、指标和插件,均由第三方开发者提供,仅供信息参考和技术访问之用。cTrader Store 并非经纪商,不提供投资建议、个人推荐或任何未来业绩保证。


价格
注册日期 15/06/2025
672
免费安装