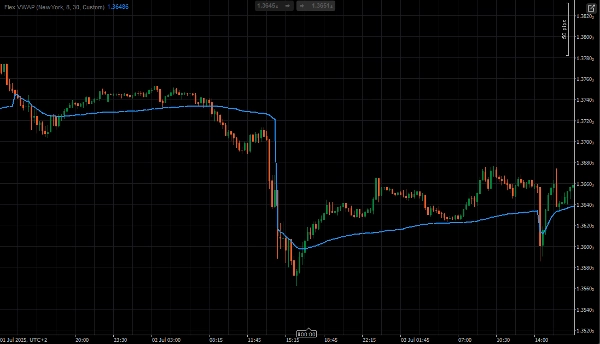
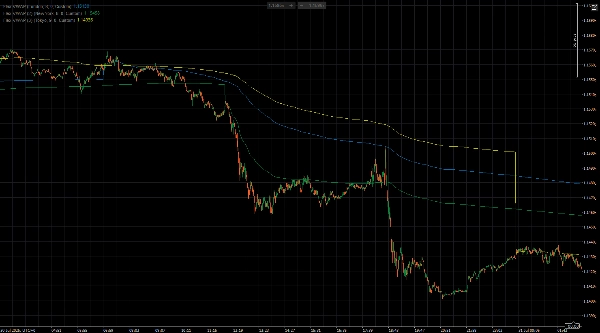
"Flex VWAP" 标识
Flex VWAP
5.0
评价:1
"Flex VWAP" 已上传图片
"Flex VWAP" 已上传图片
注册日期 15/06/2025
515
免费安装

The Flex VWAP indicator provides a volume-weighted average price calculation with highly customizable reset periods including yearly, monthly, weekly, daily, hourly intervals, and custom time settings. It supports multiple timezone configurations (New York, London, Tokyo, Sydney, Local) allowing traders to align VWAP calculations with specific trading sessions. Users can set custom reset times down to the minute for precise session management and personalized trading strategies. The VWAP line updates in real-time using typical price methodology and provides a reliable reference for institutional trading levels and market bias analysis.

Forex Session Settings
==================

London Session
Base TimeZone: London
Custom Hour: 8
Custom Minute: 0
Reset Period: Custom

New York Session
Base TimeZone: NewYork
Custom Hour: 8
Custom Minute: 0
Reset Period: Custom

Tokyo Session
Base TimeZone: Tokyo
Custom Hour: 9
Custom Minute: 0
Reset Period: Custom


Stock Exchange Session Settings
==========================

London Session
Base TimeZone: London
Custom Hour: 8
Custom Minute: 0
Reset Period: Custom

New York Session
Base TimeZone: NewYork
Custom Hour: 9
Custom Minute: 30
Reset Period: Custom

Tokyo Session
Base TimeZone: Tokyo
Custom Hour: 9
Custom Minute: 0
Reset Period: Custom

Indicator profile
5.0
评价:1
5
100 %
4
0 %
3
0 %
2
0 %
1
0 %
客户评价
July 14, 2025
Same as description, good parameters
Products available through cTrader Store, including trading bots, indicators and plugins, are provided by third-party developers and made available for informational and technical access purposes only. cTrader Store is not a broker and does not provide investment advice, personal recommendations or any guarantee of future performance.

该作者的其他作品

Simple MACD Histogram with color-coded rising (green) and falling (red) momentum bars.

猜您喜欢

Golden Candle Fib By Wejoy
TDI indicator with Stoch and BB
Volume distribution analysis with Market Profile TPO integration.
"Identify key market zones and visualize support/resistance from multiple timeframes on a single chart.
Regression Channel plots dynamic upper/lower bands around price to highlight trend direction, volatility, and potential
Order Block PRO — Smart Institutional Zone Detector
Colored Bollinger Bands Width
The Floating Risk Indicator is an essential tool for traders who prioritize risk management.
Initial Range – Where the open writes the script.
Displays real-time balance, equity, P&L, margin metrics directly on your charts.
Volume Bubbles is a lightweight yet powerful visual indicator for cTrader
RANGE DELTA CANDLE VOLUME PROFILE
Wstęgi HTS 33 144 mobile
Customizable corner watermark — display symbol, timeframe, broker, or a live candle countdown without cluttering chart
The QQE indicator is a technical analysis tool designed to identify potential trend changes and trading signals 📈📉
FlexSR auto‑detects pivot highs/lows to plot dynamic support & resistance lines Features customizable styling and option
AI Quantum Trading Edge: Your Intelligent Trading Assistant
Adaptive Median Filter calculates price median to eliminate noise and extreme values.
注册日期 15/06/2025
515
免费安装