
Opis
Taiz Pro Volume Profile: Ostateczne narzędzie analityczne do odkrywania intencji rynku
Czy masz dość polegania na wskaźnikach opóźnionych, które nie dają pełnego obrazu? Wskaźnik Taiz Pro Volume Profile to nie tylko kolejne narzędzie, to twoje okno do zobaczenia, co dzieje się "za kulisami" na rynku.
W przeciwieństwie do tradycyjnych wskaźników wolumenu, które pokazują "kiedy" dokonano transakcji, ten wskaźnik ujawnia "gdzie" dokonano transakcji, dając ci prawdziwą przewagę konkurencyjną.
---
· Co oferuje ten wskaźnik?
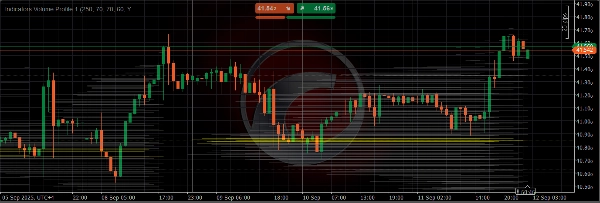
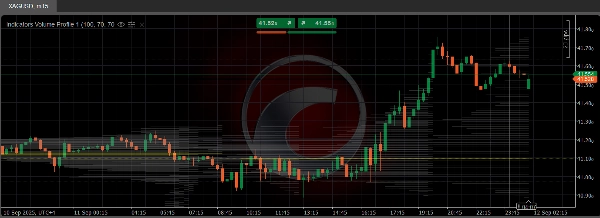
o 📈 Identyfikacja obszarów wysokiej płynności: Odkryj poziomy cenowe, na których koncentruje się największy wolumen transakcji. To są obszary, które bronią twórcy rynku i duże instytucje.
o 🎯 Punkt kontroli (Point of Control - POC):* Wskaźnik wyraźnie pokazuje (żółtą linią) poziom cenowy, przy którym nastąpił największy wolumen transakcji. Ten poziom działa jak magnes dla ceny oraz jest bardzo ważnym obszarem wsparcia lub oporu.
o 📊 Obszar wartości (Value Area - VA): Określa zakres cenowy (w kolorze szarym), w którym dokonano 70% transakcji. Handel powyżej tego obszaru to silny sygnał wzrostowy, a poniżej to sygnał spadkowy.
o 💡 Bardziej inteligentne decyzje handlowe: Wykorzystaj te obszary do precyzyjnego określania punktów wejścia, ustawiania zleceń stop loss w bezpiecznych miejscach oraz wyznaczania realistycznych celów zysku.
---
· Dlaczego ten wskaźnik jest lepszy?
o Wyjątkowa precyzja obliczeń: Wykorzystuje zaawansowany algorytm do dokładnego rozłożenia wolumenu na każdą ruch cenowy, co daje bardziej realistyczny wynik.
o Łatwość użycia: Prosty interfejs i jasne ustawienia pozwalają dostosować wskaźnik do twojego stylu analizy.
o Stabilna wydajność: Kod został zaprojektowany tak, aby był lekki i stabilny, co gwarantuje, że nie spowolni twojej platformy cTrader.
Podnieś swoją analizę techniczną na wyższy poziom. Zacznij handlować na podstawie rzeczywistych danych, a nie tylko przypuszczeń. Pobierz wskaźnik teraz.
Podsumowanie
Key features include:
- High liquidity zones: Identifies price levels with the largest traded volumes, often defended by market makers and institutions.
- Point of Control (POC): Marks the price level with the highest volume using a yellow line, serving as a critical support or resistance area.
- Value Area (VA): Displays the price range where 70% of trading volume occurred, shaded in gray; trading above this area suggests bullish momentum, while below indicates bearish signals.
- Precision trading decisions: Helps users pinpoint entry points, set stop-loss orders safely, and establish realistic profit targets.
The indicator employs an advanced algorithm for accurate volume distribution across price movements, ensuring realistic results. It features a user-friendly interface with customizable settings and is optimized for stable, lightweight performance on the cTrader platform.
Applicable markets include Forex, indices, commodities, stocks, and cryptocurrencies, supporting symbols like EURUSD, GBPUSD, XAUUSD, BTCUSD, NAS100, and others. This tool aids traders in making data-driven decisions based on volume profile analysis.
Opinie klientów
5 | 0 % | |
4 | 100 % | |
3 | 0 % | |
2 | 0 % | |
1 | 0 % |


