
说明
价格: 免费
再也不会错过蜡烛计时!
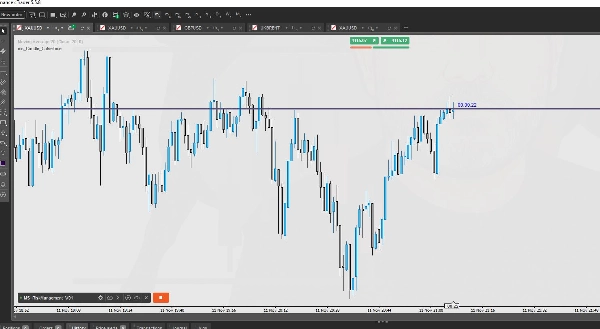
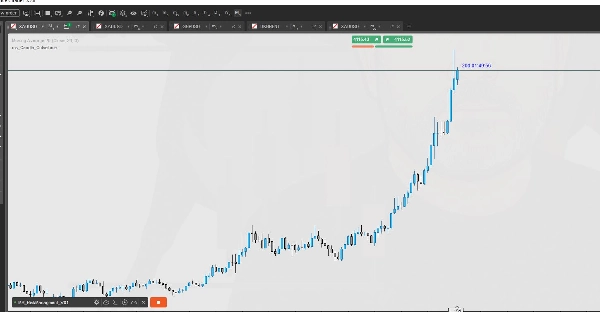
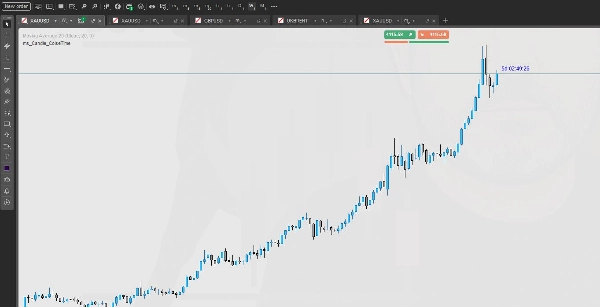
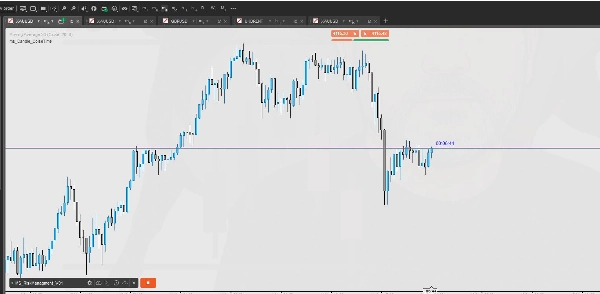
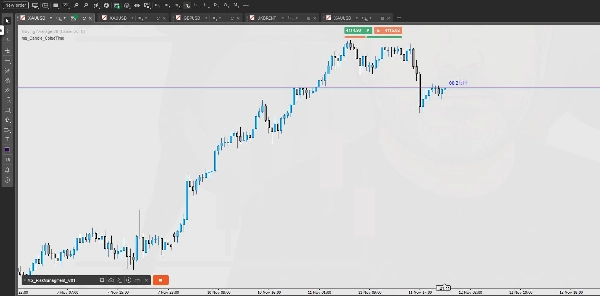
该 剩余蜡烛时间 指标显示当前蜡烛关闭的 准确剩余时间 — 跨越 所有时间框架 和 任何工具 — 随着市场动态实时更新。
💡 主要特点
- 多时间框架支持 — 无缝适用于 所有 时间框架(从1分钟到1个月图表)。
- 实时倒计时 — 每个tick持续更新,完美同步市场时钟。
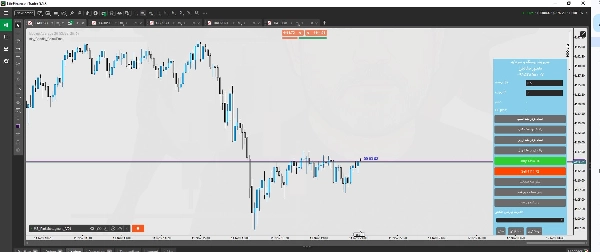
- 浮动显示 — 计时器随着实时市场价格动态移动,始终显示在您最需要的位置。
- 紧凑且清晰的界面 — 干净的排版和自动调整位置,确保最大可读性。
- 可定制位置 — 您可以轻松选择倒计时显示的位置(例如,靠近价格,右上角,左下角)。
- 轻量且快速 — 最小的CPU使用率;适合运行多个图表或指标的交易者。
⚙️ 工作原理
- 指标自动检测您图表的当前时间框架和服务器时间。
- 计算当前蜡烛关闭的准确剩余时间。
- 实时更新 — 即使市场逐tick波动时也能同步。
🧭 交易者为何喜爱它
- 非常适合 剥头皮交易者 和 日内交易者 在入场前等待蜡烛收盘。
- 帮助您掌握 突破、确认 和 蜡烛收盘信号 的时机。
- 无延迟,无刷新等待 — 纯粹的实时精准。
⚠️ 兼容性
- 平台: cTrader 桌面版
- 适用:所有符号和时间框架
- 推荐用途:任何交易风格 — 剥头皮交易,日内交易,波段交易
如何使用剩余蜡烛时间指标
该指标无需任何特殊配置。
只需将其附加到您的图表,它将根据所选时间框架自动显示当前蜡烛的剩余时间。
它适用于 所有时间框架。
摘要
AI 摘要
The ms_Candle_ColseTime indicator for cTrader Desktop provides a real-time countdown of the remaining time until the current candle closes on any chart. It automatically detects the chart’s timeframe and server time, then continuously updates the exact time left until candle closure with each market tick. This indicator supports all timeframes, from 1-minute to monthly charts, and works on all trading instruments available on the platform.
Key features include a floating display that moves dynamically with the live market price, customizable positioning options (e.g., near price, top-right, bottom-left), and a compact, clear user interface designed for readability. It is lightweight and optimized for minimal CPU usage, making it suitable for traders running multiple charts or indicators simultaneously.
This tool is particularly useful for scalpers and intraday traders who rely on precise candle close timing for entries, breakouts, confirmations, and bar close signals. It requires no special configuration—simply attach it to a chart to start viewing the countdown. The indicator supports all trading styles including scalping, day trading, and swing trading.
指标配置
客户评价
0.0
评价:0
客户评价
该产品尚无评价。已经试过了?抢先告诉其他人!
讨论
常见问答
Forex
cTrader Store 提供的所有产品,包括交易机器人、指标和插件,均由第三方开发者提供,仅供信息参考和技术访问之用。cTrader Store 并非经纪商,不提供投资建议、个人推荐或任何未来业绩保证。
该作者的其他作品


价格
20.18M
交易量
105.55K
盈利点数
978
免费安装