
Squeeze Momentum Indicator 2.0version
指标
54 下载
版本 1.0, Nov 2025
Windows 版、Mac 版
说明
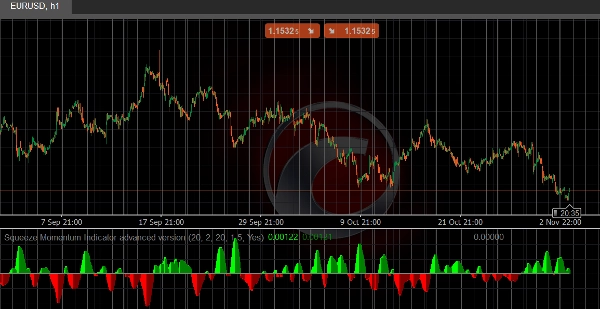
此 cTrader 指标实现了流行的挤压动量策略,旨在识别低波动性整合期和潜在的突破机会。
工作原理:
- 比较布林带与凯尔特纳通道以检测波动性“挤压”状态
- 使用线性回归计算测量动量强度
- 通过彩色编码的直方图和动态零线提供清晰的视觉信号
主要特点:
🎯 挤压检测 - 识别布林带何时进入凯尔特纳通道内(挤压)及何时扩展(突破)
📊 动量测量 - 直方图显示当前动量强度和方向
🎨 视觉信号:
- 青柠绿/绿色柱:看涨动量(增强/减弱)
- 红色/栗色柱:看跌动量(增强/减弱)
- 蓝色/黑色/灰色零线:无挤压/挤压激活/挤压释放
可自定义参数:
- 布林带长度及乘数
- 凯尔特纳通道长度及乘数
- 用于凯尔特纳通道计算的真实波幅选项
适用场景:
- 识别整合突破
- 低波动期的入场时机
- 确认动量方向
- 波段交易和持仓交易
摘要
指标配置
客户评价
0.0
评价:0
客户评价
该产品尚无评价。已经试过了?抢先告诉其他人!
讨论
常见问答
Prop
Forex
Breakout
Indices
Commodities
Crypto
Stocks
Bollinger
cTrader Store 提供的所有产品,包括交易机器人、指标和插件,均由第三方开发者提供,仅供信息参考和技术访问之用。cTrader Store 并非经纪商,不提供投资建议、个人推荐或任何未来业绩保证。
该作者的其他作品


价格
10M
交易量
10.64K
盈利点数
23
销售
1.23K
免费安装