说明
基于智能蜡烛的增量计算的专业成交量分析
释放机构级成交量分析的力量,使用 锚定增量蜡烛成交量剖面,这是cTrader最先进的锚定成交量剖面指标。专为需要精准市场洞察的严肃交易者设计,该指标通过智能的基于蜡烛的增量计算揭示真实市场活动所在。
🎯 主要特点
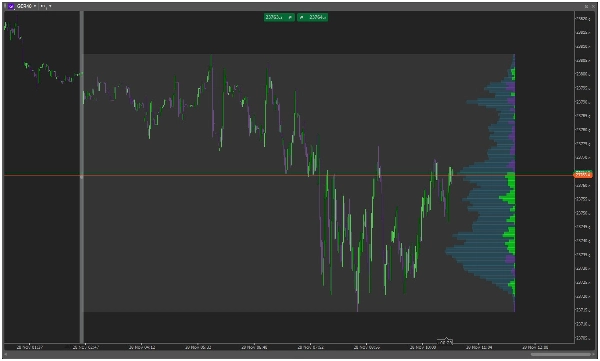
🏓 智能锚定系统
- 只需在图表上任意位置画一条垂直线
- 自动生成以您选择点为锚的剖面
- 随着新的价格动作动态更新
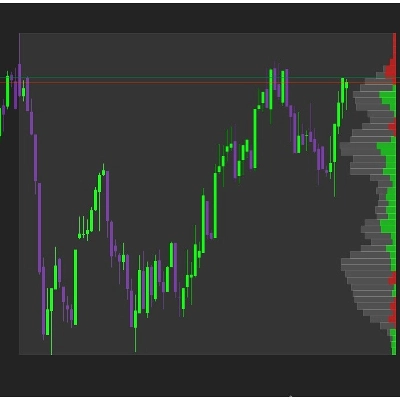
📊 智能基于蜡烛的增量
- 基于蜡烛方向的高级增量分析
- 绿色蜡烛 = 买入成交量 | 红色蜡烛 = 卖出成交量
- 每个价格水平的清晰单色可视化
- 即时识别买卖压力区域
🎨 可定制的视觉设计
- 可调节的剖面宽度(范围的5-100%)
- 买入/卖出/总成交量的可定制颜色
- 透明度控制,实现完美图表集成
- 专业阴影处理,提升可读性
⚡ 灵活的显示模式
- 增量模式:查看每个价格水平的净买卖压力
- 成交量模式:传统的成交量剖面显示
- 右侧锚定,优化图表空间利用
🚀 交易者为何喜爱它
“终于有了一个真正有效的成交量剖面!基于蜡烛的增量计算对于发现机构活动极其准确。” - 专业交易员
“对我的市场剖面分析来说是个革命性的改变。锚定系统非常出色,基于蜡烛的方法非常合理。” - 机构分析师
📈 适用对象
- 市场剖面交易者 - 识别价值区和虚假高低点
- 拍卖市场理论家 - 理解市场发展过程
- 基于成交量的策略 - 通过成交量验证确认突破
- 机构资金流分析 - 发现聪明资金的积累/分配
🛠 易于使用
- 绘制 在您的锚点处画一条垂直线
- 观察 锚定增量蜡烛成交量剖面自动生成
- 分析 各价格水平的增量分布
- 交易 利用成交量确认的水平自信交易
🔧 技术规格
- 实时计算
- 低资源消耗
- 兼容所有时间框架
- 适用于所有工具(外汇、股票、加密货币、期货)
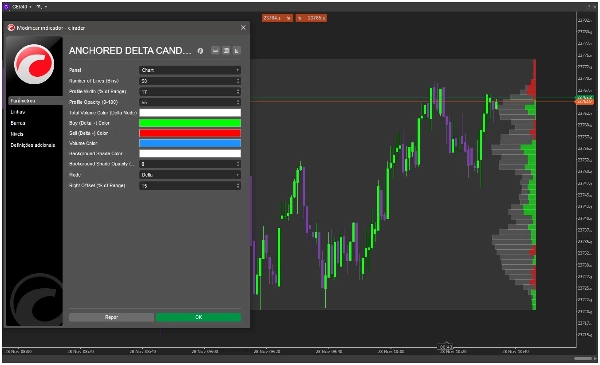
📋 包含参数
- 线条/区间数量(5-100)
- 剖面宽度百分比
- 不透明度控制
- 自定义配色方案
- 右侧偏移调整
- 显示模式(增量/成交量)
🎯 今天就改变您的图表分析!
加入成千上万的专业交易者行列,他们已经通过 锚定增量蜡烛成交量剖面提升了市场分析水平。停止猜测,开始通过精准的基于蜡烛的增量计算看到真实的市场活动。
⭐ “这个指标为成交量分析带来的清晰度无与伦比。基于蜡烛的增量方法简直是天才。”
今天就将锚定增量蜡烛成交量剖面添加到您的cTrader平台,享受机构级洞察力交易!
摘要
指标配置
客户评价
0.0
评价:0
客户评价
该产品尚无评价。已经试过了?抢先告诉其他人!
讨论
常见问答
BTCUSD
Forex
Indices
EURUSD
Commodities
GBPUSD
NZDUSD
Prop
Scalping
Fair Value Gap
SMC
Crypto
Stocks
XAUUSD
NAS100
USDJPY
VWAP
cTrader Store 提供的所有产品,包括交易机器人、指标和插件,均由第三方开发者提供,仅供信息参考和技术访问之用。cTrader Store 并非经纪商,不提供投资建议、个人推荐或任何未来业绩保证。
该作者的其他作品


价格
注册日期 14/02/2025
10
销售