
说明
偏差趋势轮廓指标
一种趋势跟踪工具,显示价格运动区域及价格大部分时间停留的位置,当趋势方向切换时,伴随颜色变化信号和声音警报。
🎯 工作原理
通过SMA斜率检测趋势: 当平均价格线上下穿过0.1的限制时,捕捉趋势变化,实时捕捉动量转变。
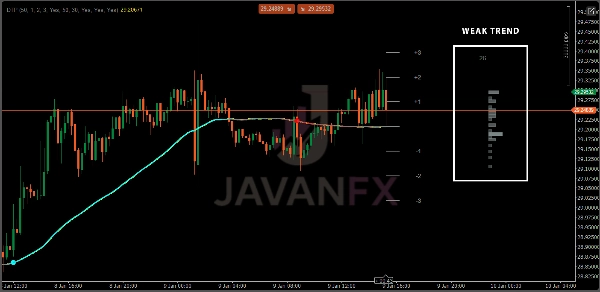
标准差区间: 使用ATR围绕平均值创建±1、±2和±3的价格带,构建灵活的区间,适应市场的波动或平稳状态。
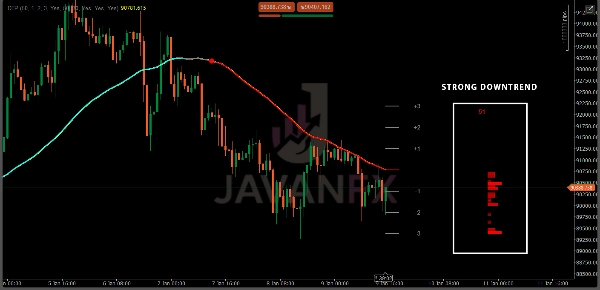
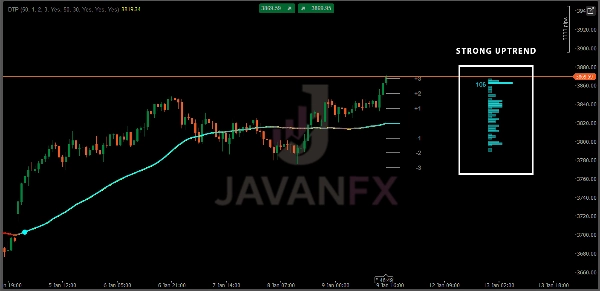
趋势分布轮廓: 构建一个横向条形图,显示当前趋势中价格在各区间收盘的频率,揭示价格偏好的停留位置。
🔵 功能特点
趋势信号: 当趋势反转时,使用彩色圆圈快速标记,便于观察动量何时翻转。
SMA渐变着色: 平均线根据移动方向变色——从红色(下降)到青色(上升),提供即时视觉反馈。
声音警报: 新的上升或下降趋势开始时可选声音通知,确保您不错过重要的市场变化。
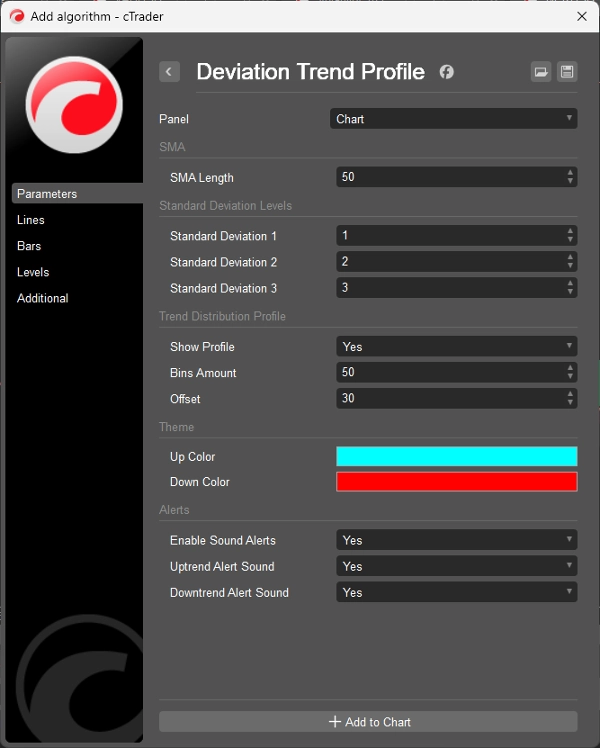
易于调整: 可更改平均长度、区间大小、图表条和颜色,以适应您的交易风格。
⚠️ 免责声明
本指标仅供教育和信息参考之用。它不保证盈利,也不预测未来价格走势。交易存在重大亏损风险,过去的表现不代表未来结果。请始终使用适当的风险管理,进行自己的分析,且切勿用无法承受损失的资金进行交易。创作者不对因使用此工具而产生的任何交易损失负责。
摘要
AI 摘要
Deviation Trend Profile is a technical indicator designed to track market trends by identifying price zones and movement patterns. It uses the slope of a Simple Moving Average (SMA) to detect trend changes when the average price line shifts beyond a set threshold, capturing momentum shifts in real time. The indicator constructs dynamic price bands at ±1, ±2, and ±3 standard deviations around the average price using the Average True Range (ATR), adapting to varying market volatility.
A sideways bar chart visualizes the distribution of closing prices within these zones during the current trend, highlighting price concentration areas. Key features include color-coded trend signals with circles that mark trend reversals, SMA line color changes reflecting trend direction (red for falling, cyan for rising), and optional audio alerts for new trend initiations. Users can customize parameters such as average length, zone sizes, chart bars, and colors to suit individual trading preferences.
This tool supports analysis across multiple markets including Forex, stocks, indices, commodities, and cryptocurrencies, and is applicable to various trading strategies like scalping and breakout trading. It provides visual and auditory cues to assist traders in monitoring trend shifts and price behavior within defined volatility zones.
指标配置
客户评价
4.6
评价:3
5 | 67 % | |
4 | 33 % | |
3 | 0 % | |
2 | 0 % | |
1 | 0 % |
客户评价
January 20, 2026
The noisy parts of the chart show up earlier, but impatience can still break the idea.
January 19, 2026
January 11, 2026
the useful bit is the journal looks less noisy. The chart still deserves a proper look.
讨论
常见问答
Prop
Forex
Signal
Breakout
Scalping
Indices
Commodities
Crypto
Stocks
AI
ATR
cTrader Store 提供的所有产品,包括交易机器人、指标和插件,均由第三方开发者提供,仅供信息参考和技术访问之用。cTrader Store 并非经纪商,不提供投资建议、个人推荐或任何未来业绩保证。


价格
注册日期 14/07/2025
60
销售