
说明
Bermaui Bands (BB) 是一种技术分析工具,帮助区分盘整和趋势价格走势。该指标背后的理念可以通过以下步骤解释 -
- 计算标准差作为在0到100之间波动的振荡器。我们称之为 Bermaui 偏差百分比(BD 百分比)。
- 如果“BD 百分比”接近零,则波动性处于极端状态。此外,如果“BD 百分比”接近100,则波动性非常低。
- 高波动性意味着市场有很大概率处于趋势状态,而低波动性意味着市场处于横盘或盘整状态。
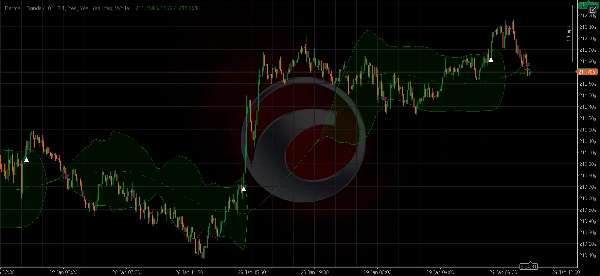
- 中线是简单移动平均线,因为标准差是基于移动平均线计算的。
- 将“BD 百分比”加到具有相同计算周期的简单移动平均线上,以获得上方 Bermaui 带。
- 从具有相同计算周期的简单移动平均线上减去“BD 百分比”,以获得下方 Bermaui 带。
摘要
指标配置
客户评价
0.0
评价:0
客户评价
该产品尚无评价。已经试过了?抢先告诉其他人!
讨论
常见问答
Forex
Signal
Breakout
Indices
Commodities
Crypto
Stocks
cTrader Store 提供的所有产品,包括交易机器人、指标和插件,均由第三方开发者提供,仅供信息参考和技术访问之用。cTrader Store 并非经纪商,不提供投资建议、个人推荐或任何未来业绩保证。
猜您喜欢


价格
注册日期 28/01/2026