Description:
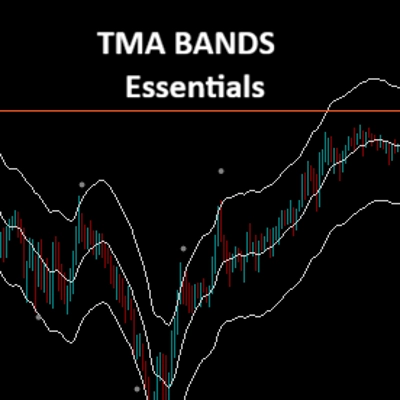
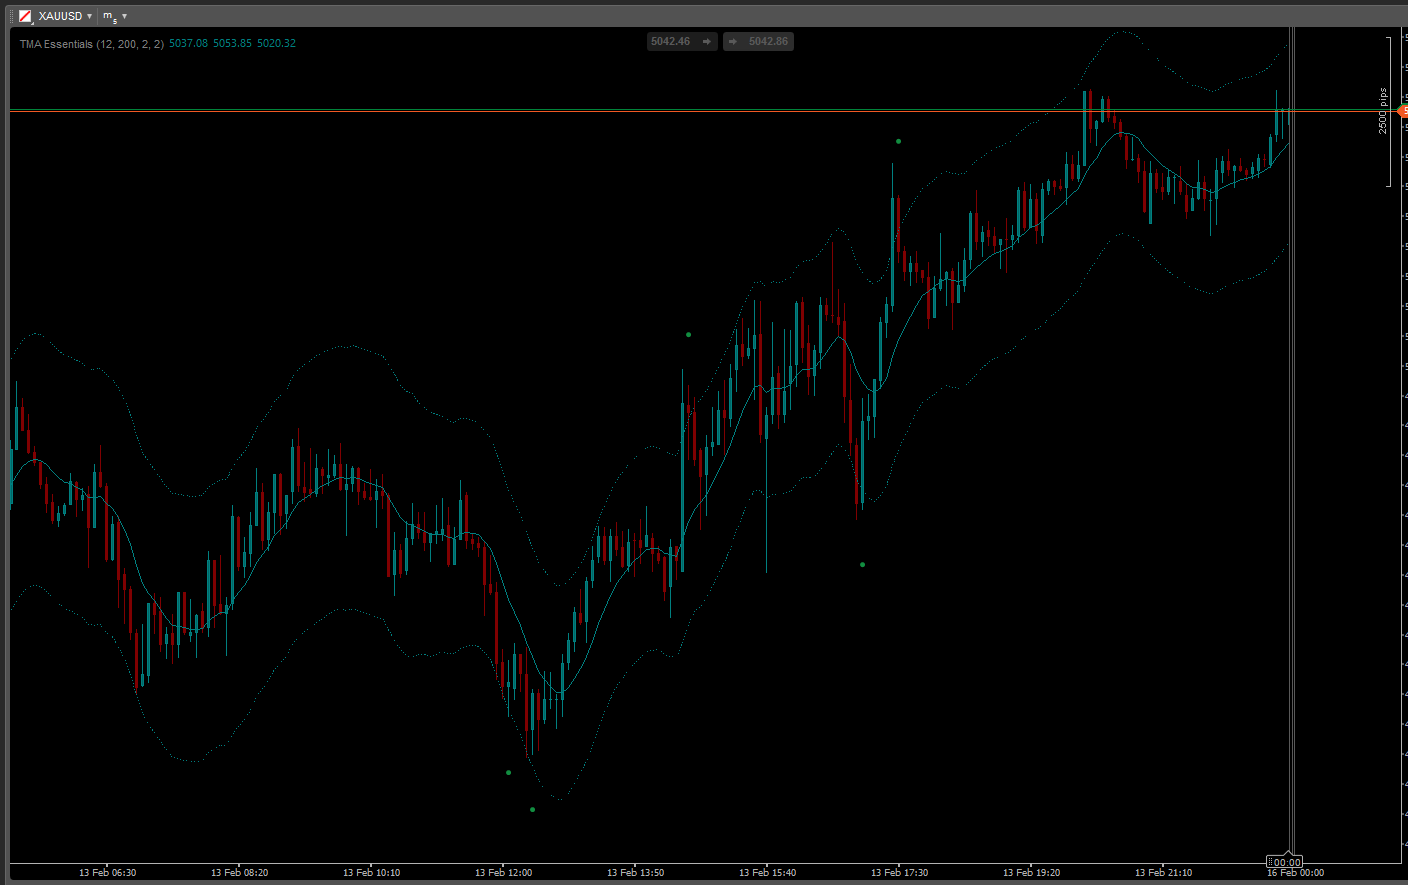
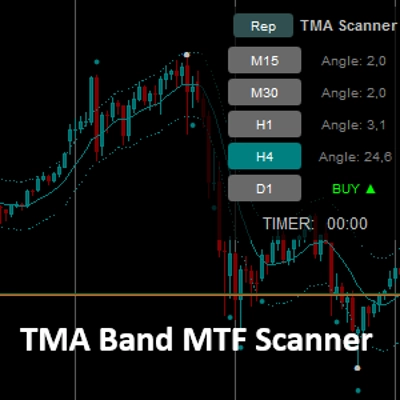
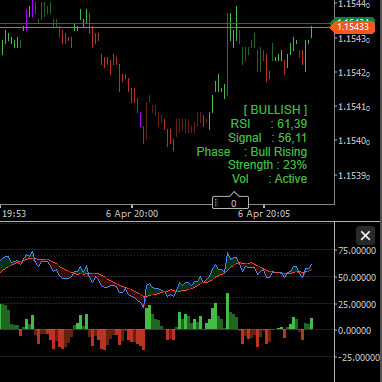
TMA Band Essentials is a sophisticated technical indicator designed for cTrader, focused on "Mean Reversion" strategies. It combines the smoothness of the Triangular Moving Average (Centered TMA) with dynamic volatility bands based on ATR (Average True Range).
This tool doesn't just draw lines; it actively scans for high-probability reversal setups by combining three critical factors: Band Interaction, Candle Patterns, and Trend Angle.
Key Features:
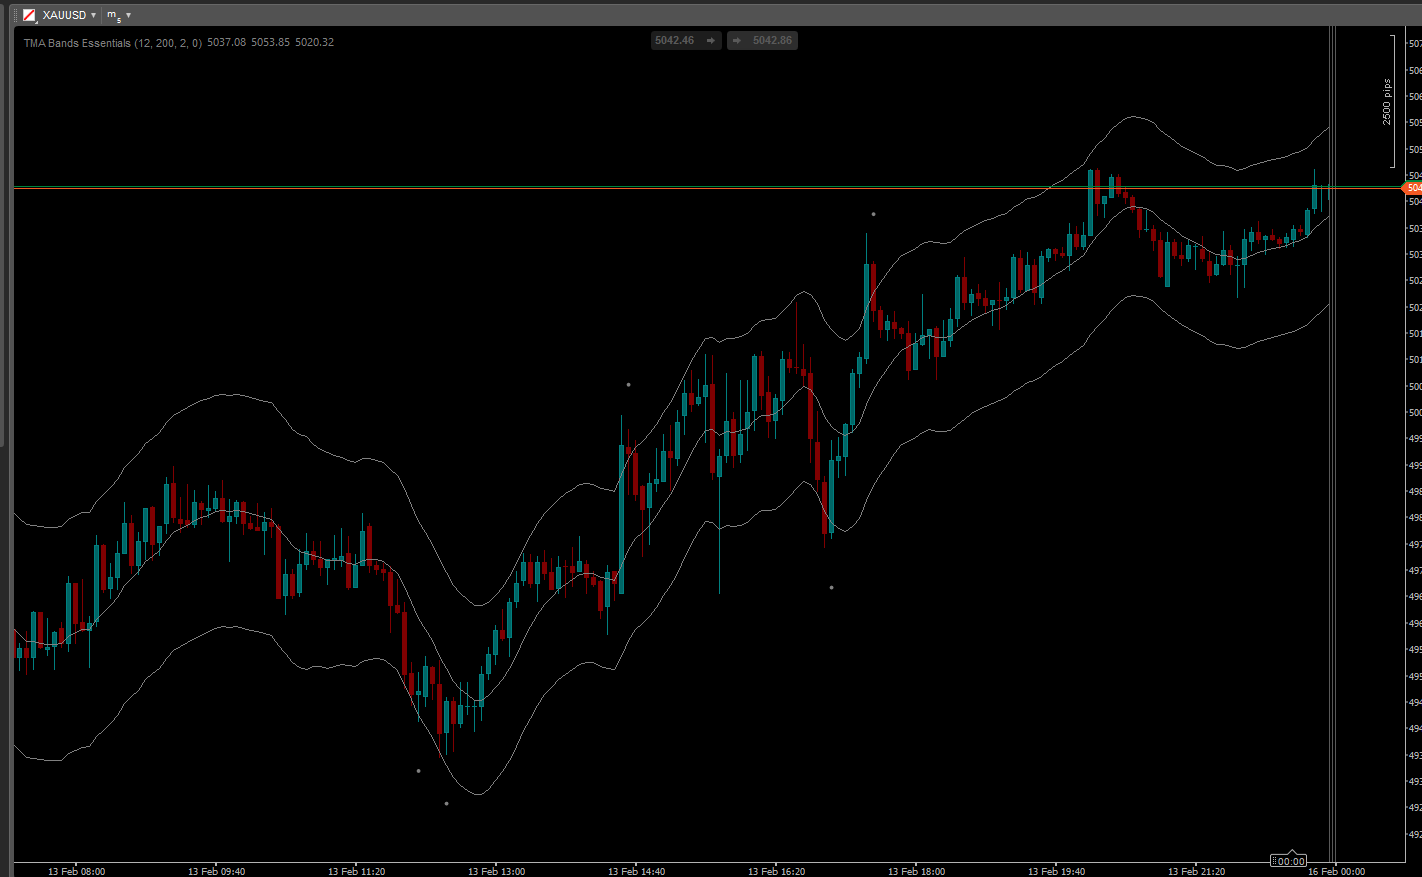
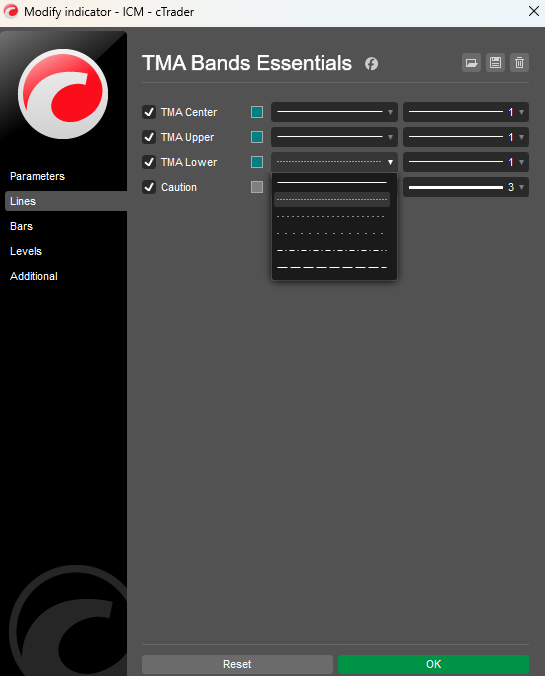
- Weighted Centered TMA: Uses a precise Weighted Price formula (High + Low + 2*Close) / 4 for the smoothest center line representation.
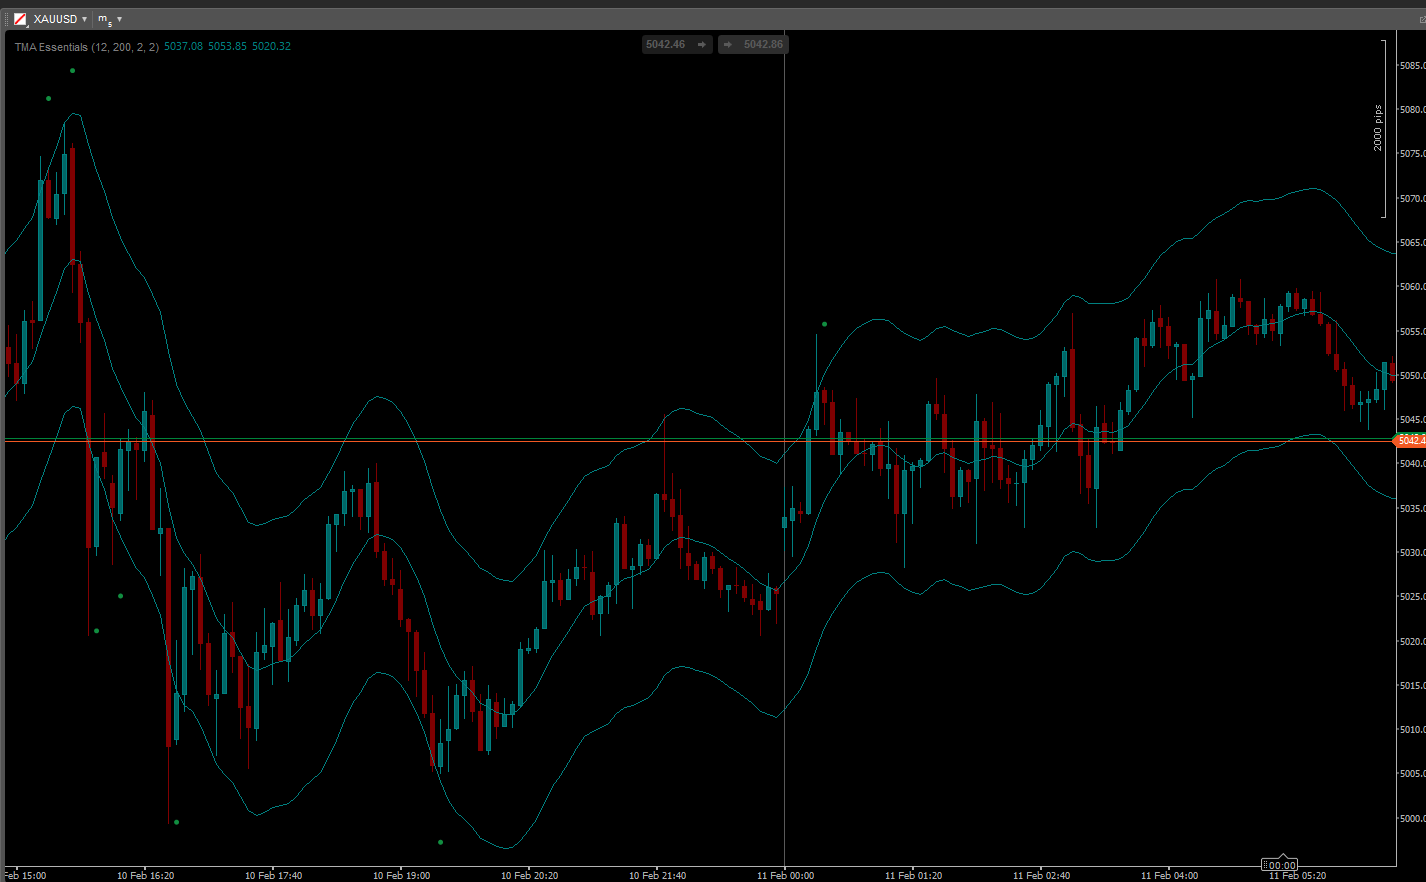
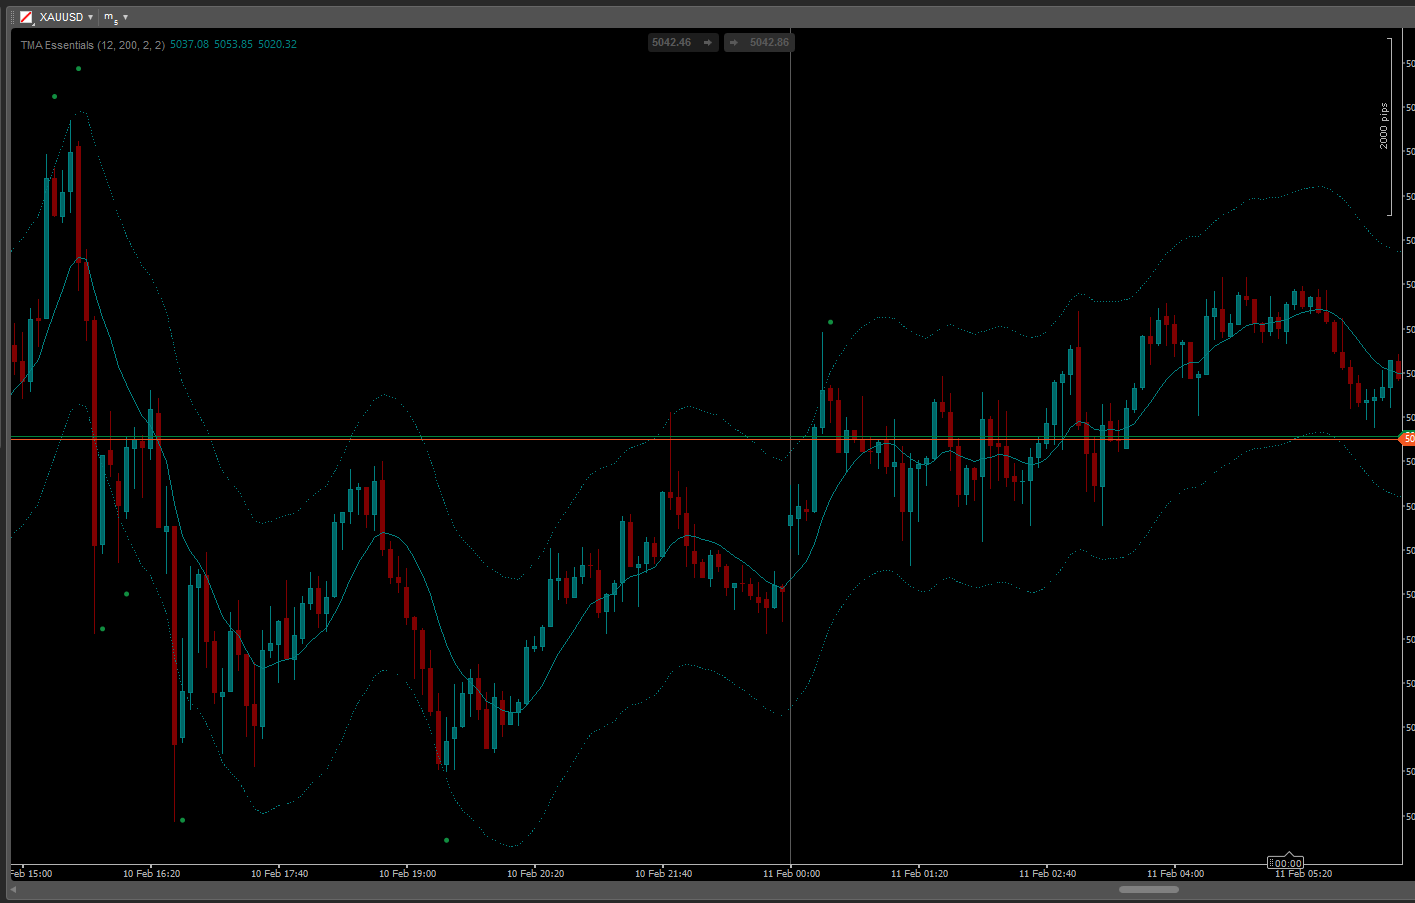
- Dynamic ATR Bands: Automatically adjusts channel width based on market volatility (ATR), helping you identify true Overbought and Oversold zones.
- Smart Signal Logic ("Caution"): The indicator plots signals only when specific price action criteria are met (Band breakout + Reversal Candle pattern).
- Angle Filtering: Includes a built-in filter to ignore signals when the trend slope is too flat, ensuring you trade with momentum logic.
How to Trade:
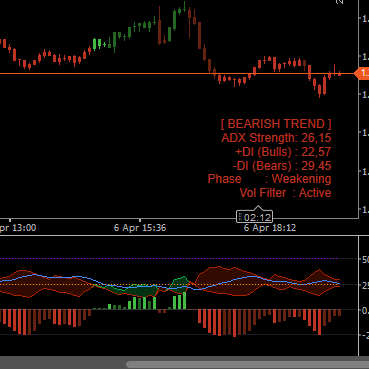
The indicator provides "Caution" signals (gray points) suggesting a potential market reversal:
- Price touches the Upper Band: If the previous candle breaks the band and the current candle shows a bearish reversal pattern, a signal is generated (potential Short).
- Price touches the Lower Band: If the previous candle breaks the band and the current candle shows a bullish reversal pattern, a signal is generated (potential Long).
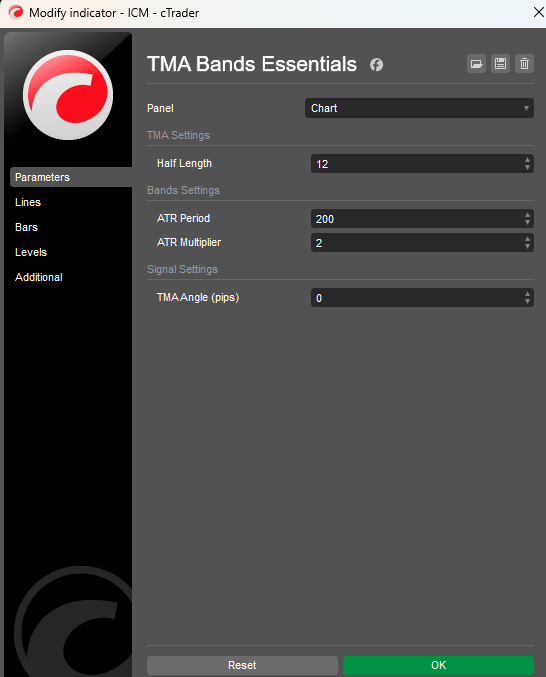
Parameters:
- Half Length: Controls the smoothness of the TMA Center line.
- ATR Period & Multiplier: Defines the sensitivity and width of the volatility bands.
- TMA Angle (pips): Minimum slope required to validate a signal (filters out noise).
Note: This indicator uses a Centered TMA calculation method to visualize the true market flow.
Indicator profile
0.0
评价:0
客户评价
该产品尚无评价。已经试过了?抢先告诉其他人!
Signal
Breakout
ATR
Products available through cTrader Store, including trading bots, indicators and plugins, are provided by third-party developers and made available for informational and technical access purposes only. cTrader Store is not a broker and does not provide investment advice, personal recommendations or any guarantee of future performance.
该作者的其他作品


猜您喜欢


12
销售
372
免费安装