
说明
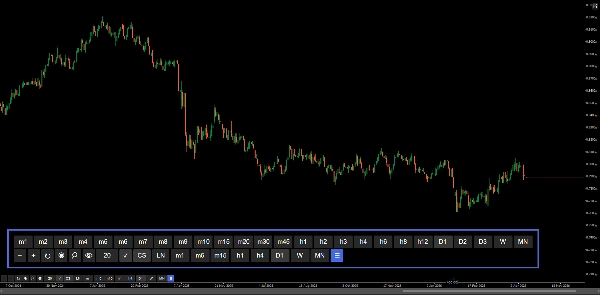
图表控制面板,实现更快速的导航——缩放、时间框架和图表设置,无需离开图表。
缩放预设、手动缩放输入、完整时间框架和图表选择器、可配置的收藏时间框架、周期分隔符、整数网格以及实时买卖线——所有功能均可通过图表上的UI按钮访问。旨在减少在活跃交易时段中导航cTrader原生菜单所花费的时间。
功能特点
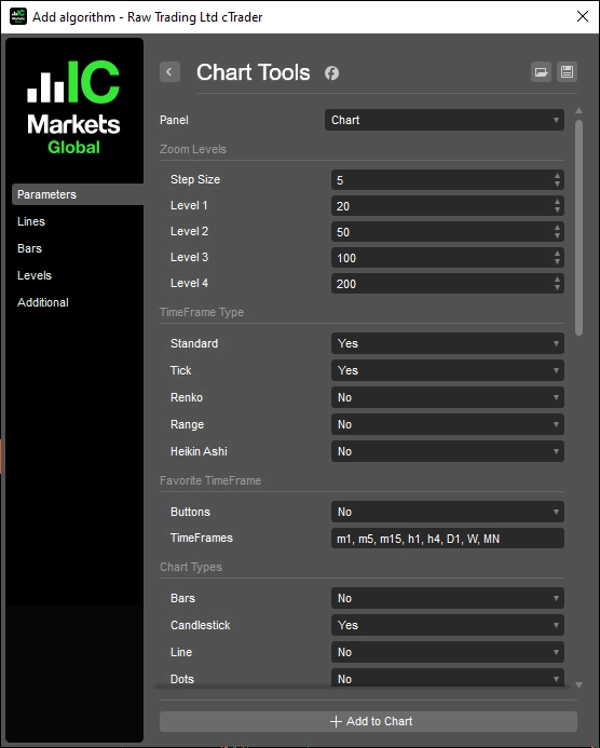
缩放控制
- 可配置步长的放大/缩小
- 四个可配置的预设缩放级别,一键访问
- 带应用按钮的手动缩放输入
- 与cTrader原生缩放事件同步
时间框架选择器
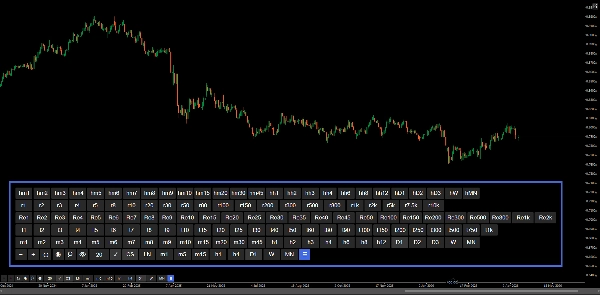
- 覆盖所有时间框架类型的完整按钮面板:标准、Heikin Ashi、Renko、范围、Tick
- 所有模式以单独行显示每种类型
- 自动高亮显示活动时间框架
- 通过☰按钮切换面板可见性
收藏时间框架
- 通过逗号分隔输入(例如 m1, h1, D1)配置快速访问行
- 支持所有时间框架类型,包括范围和Tick
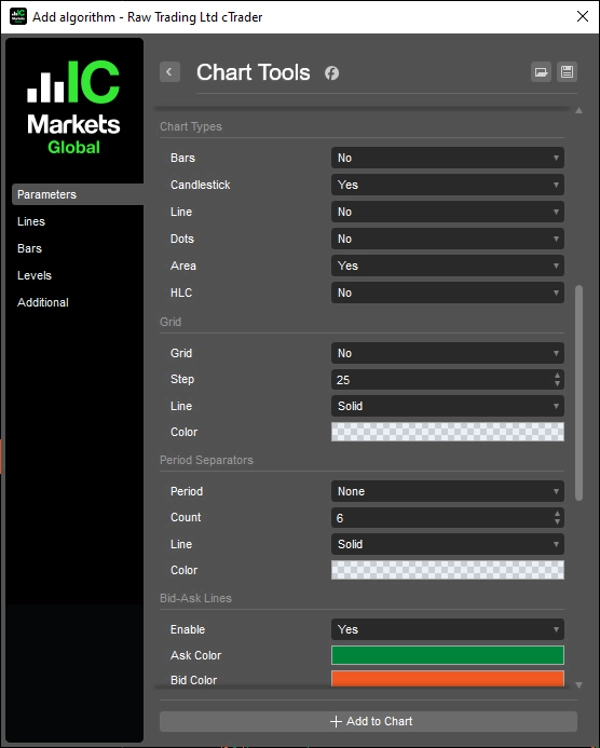
图表类型
- 快速切换按钮:柱状图、蜡烛图、折线图、点图、面积图、HLC
- 自动高亮显示活动图表类型
- 每个按钮可通过参数单独配置
网格
- 基于整数的网格,带可配置的点差间隔(乘数)
- 带智能小数格式的价格标签
- 线条延伸至最后一个柱状图之后的10个柱
- 启用/禁用切换
周期分隔符
- 日、周、月和年分隔符
- 可配置数量、颜色、线型和厚度
- 滚动和缩放时自动更新
买卖线
- 实时买入和卖出线,延伸至无限远
- 可配置买卖颜色
- 启用/禁用切换
按钮
- 位置:右上、左上、右下、左下
- 可配置边距
- 可配置按钮颜色和文本颜色——包括激活状态、应用缩放和图表切换按钮
__________________________________________________________________________________________
更多免费指标
探索广泛的市场分析工具——从结构和成交量到回归、波动率和自定义时间框架。
源代码可在GitHub 仓库中获取。
全部免费使用。但如果您愿意支持一杯咖啡,可以通过 这里进行捐赠。
支撑/阻力
成交量
移动平均线
实用工具/自定义
基于回归
波动率
振荡器
__________________________________________________________________________________________
免责声明
交易存在风险。此指标仅用于技术分析——请始终应用适当的风险管理并负责任地交易。
反馈与改进
如果您有建议、功能请求或改进想法,请在讨论标签页中留言。您的反馈有助于为所有人改进该指标。
摘要
AI 摘要
Chart Tools is a comprehensive chart control panel designed for the cTrader platform to enhance navigation and chart customization without leaving the chart interface. It provides zoom controls with configurable step sizes, four preset zoom levels, and manual zoom entry synchronized with native zoom events. The timeframe selector covers all types including Standard, Heikin Ashi, Renko, Range, and Tick, with an option to toggle panel visibility and highlight the active timeframe automatically.
Users can configure a quick-access row of favorite timeframes supporting all timeframe types. The chart type switcher offers quick buttons for Bars, Candlestick, Line, Dots, Area, and HLC charts, each with individual configuration and automatic active state highlighting.
Additional features include a round numbers-based grid with configurable pip intervals and smart decimal formatting, daily to yearly period separators with customizable appearance, and live bid/ask lines extending indefinitely with color customization and toggle options.
The control panel’s buttons can be positioned in any corner of the chart with configurable margins and colors, including active states and zoom application. This tool aims to streamline active trading sessions by reducing time spent navigating native menus, supporting efficient technical analysis on various chart types and timeframes.
指标配置
客户评价
5.0
评价:1
5 | 100 % | |
4 | 0 % | |
3 | 0 % | |
2 | 0 % | |
1 | 0 % |
客户评价
April 29, 2026
Ultimate Productivity Booster for cTrader! This tool is a massive time-saver. The on-chart UI allows for lightning-fast navigation across all timeframe types (Renko, Range, Tick) without digging through menus. I love the customizable zoom presets, round numbers grid, and the seamless integration of live bid/ask lines. It keeps my workspace clean and my execution fast during active sessions. A must-have utility for any professional trader looking to optimize their workflow. Highly recommended!
讨论
常见问答
Signal
Breakout
Scalping
SMC
Grid
AI
Martingale
cTrader Store 提供的所有产品,包括交易机器人、指标和插件,均由第三方开发者提供,仅供信息参考和技术访问之用。cTrader Store 并非经纪商,不提供投资建议、个人推荐或任何未来业绩保证。


猜您喜欢


!["Smart Money Concepts (SMC) [Iridio Capital]" 标识](https://cdn.ctrader.com/image/webp/28b69fd1-ef54-4bed-9487-07e78e883be4_40934)


!["[CB] Pivot Points Pro" 标识](https://cdn.ctrader.com/image/webp/43463c82-67b0-4f10-a4ba-901bba091d81_32594)


价格
注册日期 20/12/2024
8.09K
免费安装